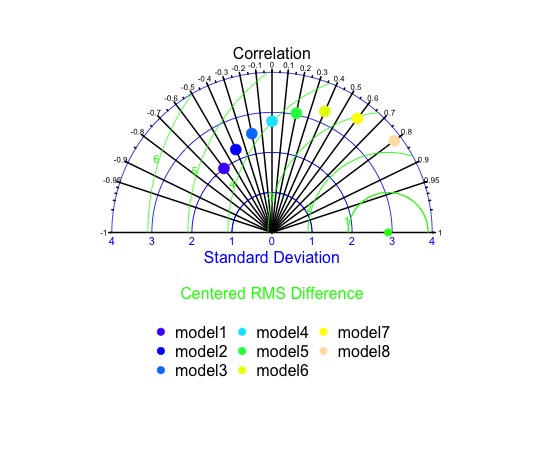
One option is to use a different package, such as openair, which might be more flexible. Because of your specific requirements it might be easier to use code designed for your requirements. I wrote some code to generate the following plot, which is close to your desired plot. You can hack the code to adjust the plot to your desired format.
![enter image description here]()
# code to make a Taylor diagram
# formulas found in http://www-pcmdi.llnl.gov/about/staff/Taylor/CV/Taylor_diagram_primer.pdf
# and http://rainbow.llnl.gov/publications/pdf/55.pdf

# correlations and tick marks (only major will have a line to the center)
# minor will have a tick mark
correlation_major <- c(seq(-1,1,0.1),-0.95,0.95)
correlation_minor <- c(seq(-1,-0.95,0.01),seq(-0.9,9,0.05),seq(0.95,1,0.01))

# test standard deviation tick marks (only major will have a line)
sigma_test_major <- seq(1,4,1)
sigma_test_minor <- seq(0.5,4,0.5)

# rms lines locations
rms_major <- seq(1,6,1)

# reference standard deviation (observed)
sigma_reference <- 2.9

# color schemes for the liens
correlation_color <- 'black'
sigma_test_color <- 'blue'
rms_color <- 'green'

# line types
correlation_type <- 1
sigma_test_type <- 1
rms_type <- 1

# plot parameters
par(pty='s')
par(mar=c(3,3,3,3)+0.1)

# creating plot with correct space based on the sigma_test limits
plot(NA
     ,NA
     ,xlim=c(-1*max(sigma_test_major),max(sigma_test_major))
     ,ylim=c(-1*max(sigma_test_major),max(sigma_test_major))
     ,xaxt='n'
     ,yaxt='n'
     ,xlab=''
     ,ylab=''
     ,bty='n')

#### adding sigma_test (standard deviation)
# adding semicircles
for(i in 1:length(sigma_test_major)){
  lines(sigma_test_major[i]*cos(seq(0,pi,pi/1000))
       ,sigma_test_major[i]*sin(seq(0,pi,pi/1000))
       ,col=sigma_test_color
       ,lty=sigma_test_type
       ,lwd=1
    )
}

# adding horizontal axis
lines(c(-1*max(sigma_test_major),max(sigma_test_major))
     ,c(0,0)
     ,col=sigma_test_color
     ,lty=sigma_test_type
     ,lwd=1)

# adding labels
text(c(-1*sigma_test_major,0,sigma_test_major)
     ,-0.2
     ,as.character(c(-1*sigma_test_major,0,sigma_test_major))
     ,col=sigma_test_color
     ,cex=0.7)

# adding title
text(0
     ,-0.6
     ,"Standard Deviation"
     ,col=sigma_test_color
     ,cex=1)

#### adding correlation lines, tick marks, and lables
# adding lines
for(i in 1:length(correlation_major)){

  lines(c(0,1.02*max(sigma_test_major)*cos(acos(correlation_major[i])))
        ,c(0,1.02*max(sigma_test_major)*sin(acos(correlation_major[i])))
        ,lwd=2
        ,lty=correlation_type
        ,col=correlation_color
  )
}

# adding minor tick marks for correlation
for(i in 1:length(correlation_minor)){

  lines(max(sigma_test_major)*cos(acos(correlation_minor[i]))*c(1,1.01)
        ,max(sigma_test_major)*sin(acos(correlation_minor[i]))*c(1,1.01)
        ,lwd=2
        ,lty=correlation_type
        ,col=correlation_color
  )
}

# adding labels for correlation
text(1.05*max(sigma_test_major)*cos(acos(correlation_major))
     ,1.05*max(sigma_test_major)*sin(acos(correlation_major))
     ,as.character(correlation_major)
     ,col=correlation_color
     ,cex=0.5)

# adding correlation title
text(0
     ,max(sigma_test_major)+0.5
     ,"Correlation"
     ,col=correlation_color
     ,cex=1)


#### adding rms difference lines
# adding rms semicircles
for(i in 1:length(rms_major)){
  inds <- which((rms_major[i]*cos(seq(0,pi,pi/1000))+sigma_reference)^2 + (rms_major[i]*sin(seq(0,pi,pi/1000)))^2 < max(sigma_test_major)^2)
  lines(rms_major[i]*cos(seq(0,pi,pi/1000))[inds]+sigma_reference
        ,rms_major[i]*sin(seq(0,pi,pi/1000))[inds]
        ,col=rms_color
        ,lty=rms_type
        ,lwd=1
  )
}

# adding observed point
points(sigma_reference
       ,0
       ,pch=19
       ,col=rms_color
       ,cex=1)

# adding labels for the rms lines
text(-1*rms_major*cos(pi*rms_major/40)+sigma_reference
     , rms_major*sin(pi*rms_major/40)
     ,as.character(rms_major)
     ,col=rms_color
     ,cex=0.7
     ,adj=1)

# adding title
text(0
     ,-1.5
     ,'Centered RMS Difference'
     ,col=rms_color
     ,cex=1
     ,adj=0.5)


###################### adding points #####################
names <- paste("model",seq(1,8),sep='')
correl_names <- seq(-0.6,0.8,by=0.2)
std_names <- seq(2,4,by=0.26)
color_names <- topo.colors(length(names))
points(std_names*cos(acos(correl_names))
       ,std_names*sin(acos(correl_names))
       ,col=color_names
       ,pch=19
       ,cex=1.5)

# making legend
par(xpd=TRUE)
legend(0,-2
       ,names
       ,pc=19
       ,col=color_names
       ,ncol=3
       ,bty='n'
       ,xjust=0.5)


