What is the best method for using Datashader to plot data from a NumPy array?
Asked Answered
M

2

10

In following the Datashader example notebook demonstrating lines, the input is a Pandas DataFrame (though it seems a Dask DataFrame would work as well). My data is in a NumPy array. Can I use Datashader to plot lines from NumPy arrays without first putting them into a DataFrame?

The documentation for line glyph seems to indicate this is possible but I did not find an example. The example notebook I linked to uses Canvas.line which I did not find in the documentation.

Menke answered 10/2, 2017 at 14:59 Comment(0)
M
2

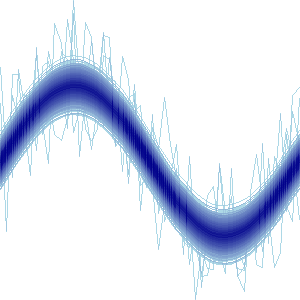
The OrderedDict and xarray.concat method was incredibly slow when applied to many data curves. The following example demonstrates a much faster method. See this GitHub issue for timings and further discussion.

import pandas as pd
import numpy as np
import datashader
import bokeh.plotting
import collections
import xarray
import time
from bokeh.palettes import Colorblind7 as palette

bokeh.plotting.output_notebook()

# create some data worth plotting
nx = 50
x = np.linspace(0, np.pi * 2, nx)
y = np.sin(x)
n = 10000
data = np.empty([n+1, len(y)])
data[0] = x
prng = np.random.RandomState(123)

# scale the data using a random normal distribution
offset = prng.normal(0, 0.1, n).reshape(n, -1)
data[1:] = y
data[1:] += offset

# make some data noisy
n_noisy = prng.randint(0, n,5)
for i in n_noisy:
    data[i+1] += prng.normal(0, 0.5, nx)

dfs = []
split = pd.DataFrame({'x': [np.nan]})
for i in range(len(data)-1):
    x = data[0]
    y = data[i+1]
    df = pd.DataFrame({'x': x, 'y': y})
    dfs.append(df)
    dfs.append(split)

df = pd.concat(dfs, ignore_index=True)   

canvas = datashader.Canvas(x_range=x_range, y_range=y_range, 
                           plot_height=300, plot_width=300)
agg = canvas.line(df, 'x', 'y', datashader.count())
img = datashader.transfer_functions.shade(agg, how='eq_hist')
img

enter image description here

Menke answered 23/2, 2017 at 5:9 Comment(0)
M
7

I did not find a way to plot data in a NumPy array without first putting it into a DataFrame. How to do this was not especially intuitive, it seems Datashader requires the column labels to be non-numeric strings, so they can be called using the df.col_label syntax (rather than the df[col_label] syntax, perhaps there is a good reason for this though).

With the current system I had to do the following to get the NumPy array into a DataFrame with column labels Datashader would accept.

df = pd.DataFrame(data=data.T)
data_cols = ['c{}'.format(c) for c in df.columns]
df.columns = data_cols
df['x'] = x_values

y_range = data.min(), data.max()
x_range = x_values[0], x_values[-1]

canvas = datashader.Canvas(x_range=x_range, y_range=y_range, 
                           plot_height=300, plot_width=900)
aggs = collections.OrderedDict((c, canvas.line(df, 'q', c)) for c in data_cols)

merged = xarray.concat(saxs_aggs.values(), dim=pd.Index(cols, name='cols'))
saxs_img = datashader.transfer_functions.shade(merged.sum(dim='cols'), 
                                               how='eq_hist')

Note that the data_cols variable was important to use, rather than simply df.columns, because it had to exclude the x column (not initially intuitive).

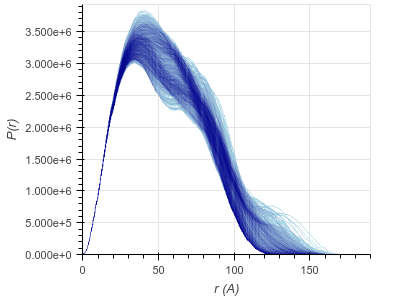
Here is an example of the resulting with axes added using bokeh. enter image description here

Menke answered 10/2, 2017 at 16:50 Comment(3)
Thanks for the feedback! I don't know of any way to use a raw NumPy array, but it would be a reasonable feature request to file as an issue at the Github site. Filing an issue about using numeric column names would also be helpful; I don't think we had any particular reason to use the col_label syntax other than convenience and that we haven't so far run across purely numeric column labels. In general, Github issues are a better way to communicate with us, so that we can keep track of comments over time.Chummy
@JamesA.Bednar For how-to's I prefer to ask questions on stack overflow, partially to help others, and also for the selfish reason of having a easily accessible reference to go back to. Do you want questions filed as Github issues? I thought this was generally discouraged. I will file an issue related to the column labels and the idea of accepting numpy arrays.Menke
SO is great for usage questions, if you think that there must already be a way to do something, and you just need someone to help you figure out what that is. But SO is a lousy way for datashader developers to keep track of feature requests and bug reports, both of which are highly unlikely to be addressed if they are sitting out in some random SO post. Of course, it's often hard to tell which situation you are in, i.e. whether it's about your own understanding or an issue with the software itself. In this case, it's the software that needs to improve, not you, so please file github issues.Chummy
M
2

The OrderedDict and xarray.concat method was incredibly slow when applied to many data curves. The following example demonstrates a much faster method. See this GitHub issue for timings and further discussion.

import pandas as pd
import numpy as np
import datashader
import bokeh.plotting
import collections
import xarray
import time
from bokeh.palettes import Colorblind7 as palette

bokeh.plotting.output_notebook()

# create some data worth plotting
nx = 50
x = np.linspace(0, np.pi * 2, nx)
y = np.sin(x)
n = 10000
data = np.empty([n+1, len(y)])
data[0] = x
prng = np.random.RandomState(123)

# scale the data using a random normal distribution
offset = prng.normal(0, 0.1, n).reshape(n, -1)
data[1:] = y
data[1:] += offset

# make some data noisy
n_noisy = prng.randint(0, n,5)
for i in n_noisy:
    data[i+1] += prng.normal(0, 0.5, nx)

dfs = []
split = pd.DataFrame({'x': [np.nan]})
for i in range(len(data)-1):
    x = data[0]
    y = data[i+1]
    df = pd.DataFrame({'x': x, 'y': y})
    dfs.append(df)
    dfs.append(split)

df = pd.concat(dfs, ignore_index=True)   

canvas = datashader.Canvas(x_range=x_range, y_range=y_range, 
                           plot_height=300, plot_width=300)
agg = canvas.line(df, 'x', 'y', datashader.count())
img = datashader.transfer_functions.shade(agg, how='eq_hist')
img

enter image description here

Menke answered 23/2, 2017 at 5:9 Comment(0)

© 2022 - 2024 — McMap. All rights reserved.