Chart JS plugin to change line color depending on value
Asked Answered
F

6

10

I am attempting to create a line chart where the color of the line (and the points) is dependant upon the value being plotted. For example if the value is above the following thresholds [0, 115, 125] then the color would be either ['green', 'yellow', 'red'] respectively.

The requirement is nearly identical to that which is achieved in this example: https://jsfiddle.net/egamegadrive16/zjdwr4fh/

The difference is that I am using react-chart-js-2 and as a result, the draw() method is not accessible in the same way. Instead, it is suggested to create a plugin to manipulate the chart.

This is the plugin code at present:

import { Chart } from "react-chartjs-2";

class variableLineColorUtils {
  selectColor(value, thresholds, colors) {
    let color = colors[0];
    thresholds.every((limit, index) => {
      if (value < limit) return false;
      else color = colors[index];
      return true;
    });

    return color;
  }
}

const variableLineColor = {
  id: "variableLineColor",
  afterDraw: (chart, easing) => {
    const options = chart.options.variableLineColor;
    if (options) {
      const utils = new variableLineColorUtils();
      const datasets = chart.config.data.datasets;

      datasets.forEach((set, i) => {
        const points = chart.getDatasetMeta(i).data;
        points.forEach((point, index) => {
          const color = utils.selectColor(
            datasets[i].data[point._index],
            options.thresholds,
            options.colors
          );

          point.custom = { borderColor: color, backgroundColor: color };
        });
        chart.update();
      });
    }
  }
};

Chart.pluginService.register(variableLineColor);

export default variableLineColor;

And these are the options used for the plugin:

variableLineColor: {
  thresholds: [0, 115, 125],
  colors: ["green", "yellow", "red"]
}

This approach only amends the color of the points themselves, not the line between the points. The line remains in the chart's default backgroundColor.

How can I amend the color of the line itself?

Fleabitten answered 12/2, 2020 at 14:28 Comment(4)
Really want to get the bonus but, does this answer your question? #56429521Cere
@keikai: Comments do not receive bounties. Please do make a canonical answer about all concerns to answer section.Papageno
@Papageno sure I know the guideline, just noticing the duplicated content feels better to be placed here rather than the answer.Cere
Really sorry about the lack of response... I was hit with a case of man-flu! As @ mico comment, to allocate a bounty I will need a working answer @Cere if you can provide one, I would be more than happy to allocate the bounty :)Fleabitten
M
6

You can use the plugins array to create a new beforeRender plugin that will accomplish this.

plugins: [{
  beforeRender: (x, options) => {
    const c = x.chart;
    const dataset = x.data.datasets[0];
    const yScale = x.scales['y-axis-0'];
    const yPos = yScale.getPixelForValue(0);

    const gradientFill = c.ctx.createLinearGradient(0, 0, 0, c.height);
    gradientFill.addColorStop(0, 'rgb(86,188,77)');
    gradientFill.addColorStop(yPos / c.height, 'rgb(86,188,77)');
    gradientFill.addColorStop(yPos / c.height, 'rgb(229,66,66)');
    gradientFill.addColorStop(1, 'rgb(229,66,66)');

    const model = x.data.datasets[0]._meta[Object.keys(dataset._meta)[0]].dataset._model;
    model.borderColor = gradientFill;
  },
}];

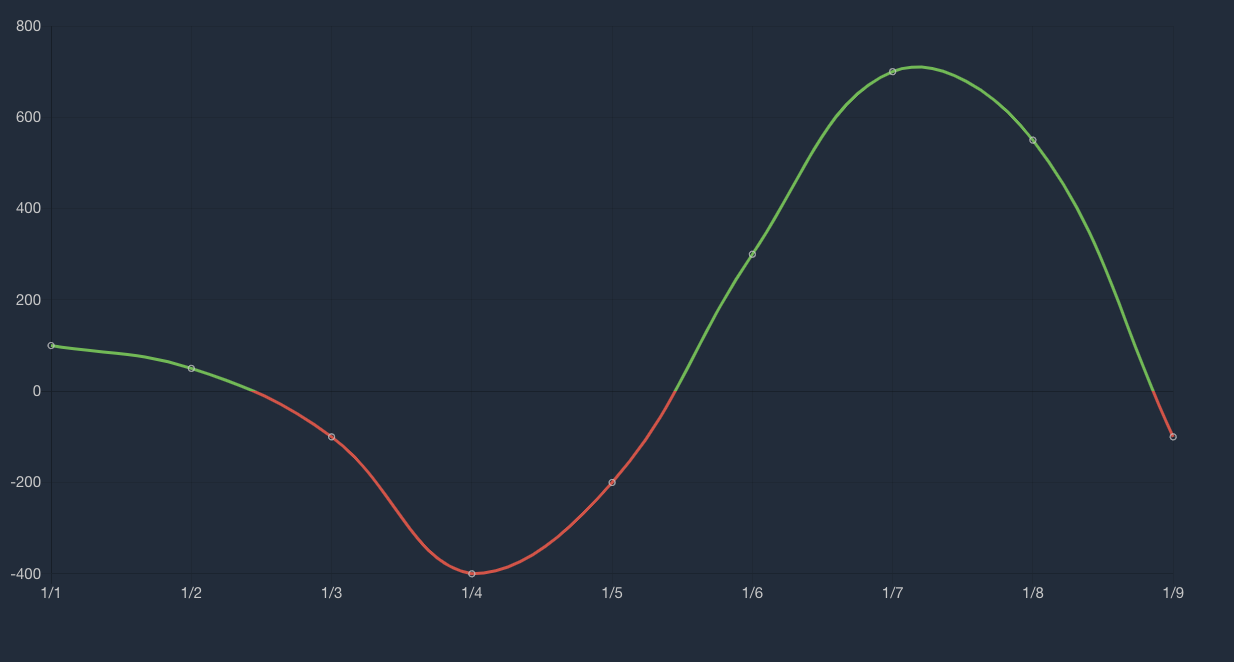
The result will look something like this:

enter image description here

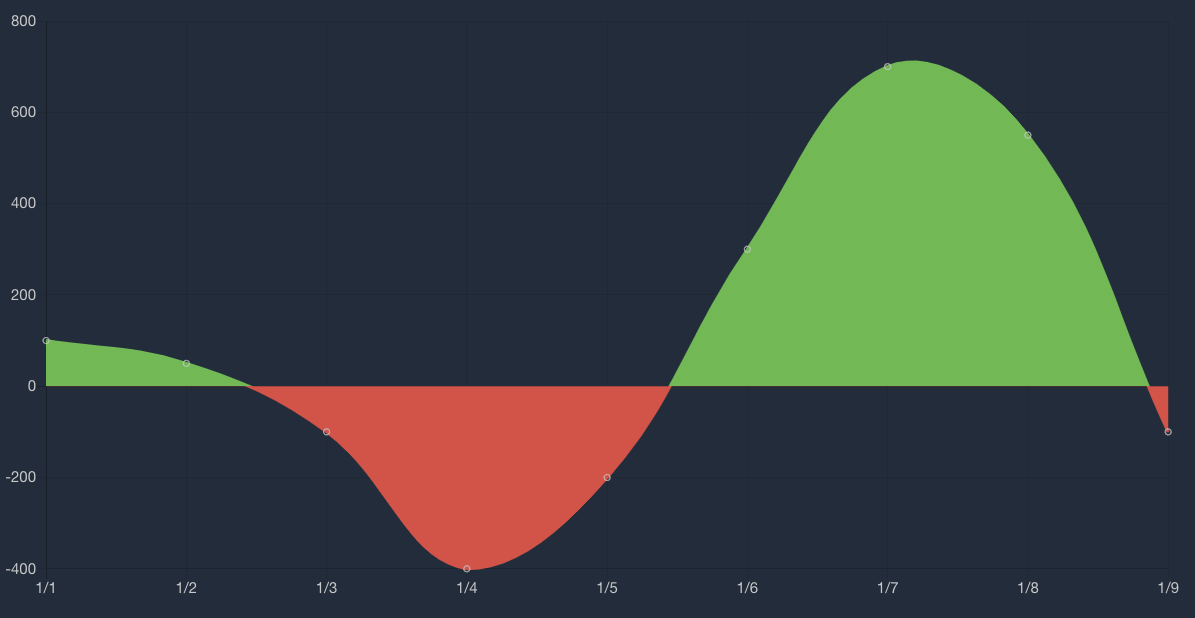
This will also work for the background color just by changing the model.borderColor line to model.backgroundColor. For example:

enter image description here

Magma answered 4/4, 2021 at 16:56 Comment(1)
Do you have an example of how this works on Chart.js 4.1+? Specifically re-creating this line: const model = x.data.datasets[0]._meta[Object.keys(dataset._meta)[0]].dataset._model;. _meta was removed from the latest version but they did add getDatasetMeta() method, which can get the dataset's meta, but I'm not sure what the second part was trying to do.Aboral
H
2

For that, you will have to manipulate your data something as I did check out the below code. I doubt if you can do it with the plugin.

import React from 'react';
import { Line } from 'react-chartjs-2';

const data = {
  labels: [1, 2, 3, 4, 5, 6, 7, 8, 9],
  datasets: [
    {
      label: 'First one',
      fill: false,
      borderColor: 'gray',
      data: [null, null, 2, 0, 3],
    },
    {
      label: 'Second one',
      fill: false,
      borderColor: 'blue',
      data: [2, 4, 2, null, null, null, null, null, null],
    },
    {
      label: 'Third one',
      fill: false,
      borderColor: 'cyan',
      data: [null, null, null, null, 3, 4, 1, null, null],
    },
  ],
}

function App() {
  return (
    <div>
      <Line
        data={data}
      />
    </div>
  );
}


export default App
Heroics answered 26/2, 2020 at 11:6 Comment(2)
I think you may be right, I've already been working on a solution which follows a similar approach today. I shall allocate you the bounty once I confirm a working solution.Fleabitten
This will not work if you want one continuous line. There will be a gap between each color.Digestant
O
1

My solution uses ChartJS version 3's new feature , being able to edit the line in segments you can write a function like this.

segment:{
  borderColor:function(context){
    const yval = context.p1.raw.y
    if (yval>=5){
      return "green"
    } else if(yval<=-5){
      return "red"
    } else{
      return "gray"
    }
  }
},

This code will return green if the value is above 5 and red if below, and gray if it's in between. I believe this is the most simplistic solution since it doesn't require making your own plugin or re-rendering the chart.

Optics answered 21/7, 2023 at 18:2 Comment(0)
M
0

Use borderColor or color instead of backgroundColor of line.

Malaco answered 25/2, 2020 at 7:43 Comment(0)
R
0

Try to use borderColor instead of backgroundColor and Please refer ChartJs StackOverflow. It may solve your problem.

Regarding answered 26/2, 2020 at 10:49 Comment(0)
O
0

In addition to @blacktide answer here is a snippet of how to do it with typescript and some tailwind classes:

Chart.register({
    id: "customLineColorPlugin",
    beforeRender: chart => {
        const ctx = chart.ctx;
        const yAxis = chart.scales["y"];
        const yPos = yAxis.getPixelForValue(0);

        const gradientFill = ctx.createLinearGradient(0, 0, 0, chart.height);
        gradientFill.addColorStop(0, "rgb(86,188,77)");
        gradientFill.addColorStop(yPos / chart.height, "rgb(86,188,77)");
        gradientFill.addColorStop(yPos / chart.height, "rgb(229,66,66)");
        gradientFill.addColorStop(1, "rgb(229,66,66)");

        const datasets = chart.data.datasets;
        datasets.forEach(dataset => {
            dataset.borderColor = gradientFill;
        });
    },
});
const LineChart: React.FC = () => {
const data = {
    labels: ["Enero", "Febrero", "Marzo", "Abril", "Mayo"],
    datasets: [
        {
            label: "Datos",
            data: [5, -2, 3, -4, 7],
            borderColor: "red",
        },
    ],
};

const options: ChartOptions<"line"> = {
    scales: {
        y: {
            beginAtZero: false,
            max: 10,
            min: -10,
        },
    },
};

useEffect(() => {
    const chart = new Chart(document.getElementById("myChart") as HTMLCanvasElement, {
        type: "line",
        data: data,
        options: options,
    });

    return () => {
        chart.destroy();
    };
    // eslint-disable-next-line react-hooks/exhaustive-deps
}, []);

return (
    <div>
        <canvas id="myChart" width={250} height={80} className="rounded-lg border bg-card p-5"></canvas>
    </div>
);
};

export default LineChart;

This is the result:

enter image description here

Oram answered 18/10, 2023 at 20:22 Comment(2)
Thanks for the solution, I'm trying out the code, but it seems that the colors of the lines do not get overwritten. Do you know what the cause of this could be?Baisden
Hi, it only appears one color in the chart? if it's so try checking the values calculated by yPos and the chart height it may be tricky in some screen's resolutions. this solution it's intended to work for the cero value of y axis, but it can be done to other values as well.Knurl

© 2022 - 2024 — McMap. All rights reserved.