Cannot insert plot into XLSX via openxlsx package when using command line
Asked Answered
M

2

10

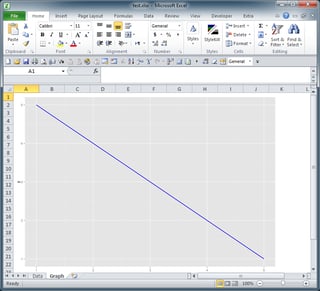
I'm trying to insert a plot into an XLSX file using the openxlsx package in R. When I use the R GUI, I am able to accomplish this.

However, when using a batch file, the plot is created but it is not inserted into the XLSX file. Instead, it is created as a separate PDF file adjacent to the newly created XLSX file (automatically named "Rplots.pdf"). The data frame is written into the XLSX file just fine.

The R script (named "insertPlot.R"):

library(ggplot2)
library(openxlsx)
wb <- createWorkbook()
addWorksheet(wb, "Data")
addWorksheet(wb, "Graph", gridLines=FALSE)
df <- data.frame(c(1:5), c(5:1))
names(df) <- c("x","y")
writeData(wb, "Data", df)
p <- ggplot(aes(x=x, y=y), data=df) + geom_line(size=1, colour="blue")
print(p)    #plot needs to be showing
insertPlot(wb, "Graph", width=11.18, height=7.82, fileType="png", units="in")
saveWorkbook(wb, "test.xlsx", overwrite=TRUE)

The batch file script:

"C:\Program Files\R\R-3.1.3\bin\RScript.exe" --no-save --no-environ --no-init-file --no-restore --no-Rconsole "C:\temp\insertPlot.R"

R GUI (Desired) Result

R Batch Command Result

In summary, I'm confused as to how to have an RScript batch file accomplish this.

Has anyone had any success or can point out my mistake?

Mizzle answered 4/11, 2015 at 23:48 Comment(1)
After further digging, I believe I have found an answer. The key is to use x11() or windows() before running the plot to get this to work. However, this is not using Rscript in its designed way. Seems I need to go back to the drawing board.Mizzle
M
10

I believe I have found a way to seamlessly accomplish this by outputting the plot to a png device and then utilizing insertImage from the openxlsx package.

library(ggplot2)
library(openxlsx)

wb <- createWorkbook()
addWorksheet(wb, "Data")
addWorksheet(wb, "Graph", gridLines=FALSE)

df <- data.frame(c(1:5), c(5:1))
names(df) <- c("x","y")
writeData(wb, "Data", df)

png("graph.png", width=1024, height=768, units="px", res=144)  #output to png device
p <- ggplot(aes(x=x, y=y), data=df) + geom_line(size=1, colour="blue")
print(p)
dev.off()  #important to shut down the active png device
insertImage(wb, "Graph", "graph.png", width=11.18, height=7.82, units="in")

saveWorkbook(wb, "test.xlsx", overwrite=TRUE)

#unlink("graph.png")  #can optionally delete the original png file

Hope this helps anyone that could be facing the same issue.

Mizzle answered 10/11, 2015 at 18:43 Comment(0)
R
0

I am new so any feedback would be appreciated:

For those looking for a Centos 7 answer using Xvfb (virtual X server environment):

install Xvfb

yum install xorg-x11-server-Xvfb

when calling Rscript use xvfb-run -a to run the script within a virtual X server environment

xvfb-run -a Rscript /mnt/todd/examples/openxlsxChart.R

Add x11() to actual R file

library(openxlsx)
x11()
## Not run: 
## Create a new workbook
wb <- openxlsx::createWorkbook()

## Add a worksheet
openxlsx::addWorksheet(wb, "Sheet 1", gridLines = FALSE) 

## create plot objects
require(ggplot2)
p1 <- qplot(mpg, data=mtcars, geom="density",
            fill=as.factor(gear), alpha=I(.5), main="Distribution of Gas Mileage")
p2 <- qplot(age, circumference,
            data = Orange, geom = c("point", "line"), colour = Tree)

## Insert currently displayed plot to sheet 1, row 1, column 1
#print(p1) #plot needs to be showing
print(p1)
insertPlot(wb, 1, width = 5, height = 3.5, fileType = "png", units = "in")

## Insert plot 2
print(p2)
insertPlot(wb, 1, xy = c("J", 2), width = 16, height = 10,  fileType = "png", units = "cm")

## Save workbook
openxlsx::saveWorkbook(wb, "/home/tmamiya/insertPlotExample.xlsx", overwrite = TRUE)

## End(Not run)
Rollmop answered 10/7, 2018 at 17:34 Comment(0)

© 2022 - 2024 — McMap. All rights reserved.