Rotate x-axis labels FacetGrid seaborn not working
Asked Answered
O

2

10

I'm attempting to create a faceted plot using seaborn in python, but I'm having issues with a number of things, one thing being rotating the x-axis labels.

I am currently attempting to use the following code:

import pandas as pd
import seaborn as sns
import matplotlib.pyplot as plt 

vin = pd.Series(["W1","W1","W2","W2","W1","W3","W4"])
word1 = pd.Series(['pdi','pdi','tread','adjust','fill','pdi','fill'])
word2 = pd.Series(['perform','perform','fill','measure','tire','check','tire'])
date = pd.Series(["01-07-2020","01-07-2020","01-07-2020","01-07-2020","01-08-2020","01-08-2020","01-08-2020"])

bigram_with_dates = pd.concat([vin,word1,word2,date], axis = 1)
names = ["vin", "word1","word2","date"]
bigram_with_dates.columns = names
bigram_with_dates['date'] = pd.to_datetime(bigram_with_dates['date'])
bigram_with_dates['text_concat'] = bigram_with_dates['word1'] + "," + bigram_with_dates['word2']

plot_params = sns.FacetGrid(bigram_with_dates, col="date", height=3, aspect=.5, col_wrap = 10,sharex = False, sharey = False)
plot = plot_params.map(sns.countplot, 'text_concat', color = 'c', order = bigram_with_dates['text_concat'])
plot_adjust = plot.fig.subplots_adjust(wspace=0.5, hspace=0.5)

for axes in plot.axes.flat:
    axes.set_xticklabels(axes.get_xticklabels(), rotation=90)

When I use this I get an error that states:

AttributeError: 'NoneType' object has no attribute 'axes'

Which I think I understand to mean that there is no returned object so setting axes on nothing does nothing.

This code seems to work in other SO posts I've come across, but I can't seem to get it to work.

Any suggestions as to what I'm doing wrong would be greatly appreciated.

Thanks, Curtis

Occident answered 5/2, 2020 at 13:55 Comment(7)
what is g? should't it be plot?Chandler
@NicolasGervais that is correct, sorry I have edited this in my post and still have the same issue in the codeOccident
The code looks fine. I think your problem is just that you do not have a minimal reproducible example and hence confused yourself with variable names.Pimpernel
@Pimpernel I have edited the post and it should now be reproducible. I have created the dataset and specified the required modules. I am still receiving the same error messageOccident
Ok, so you put a lot of stuff into a single line. Use individual lines and store things in different variables. Don't do things like FacetGrid.map(..).fig.some_method() (unless you know what you're doing)Pimpernel
@Pimpernel I would find it more helpful if you would stop the condescension and simply provide constructive feedback. Regardless of whether or not the line length is too long the code should still run, correct?Occident
Sorry, this has nothing to do with line length. It's the amount of objects that are created (and potentially not stored) with such chaining. This is just one of the best ways to shoot oneself in the foot, whereas if you created only one object per line you would see directly at which point you assigned the wrong variable.Pimpernel
A
14

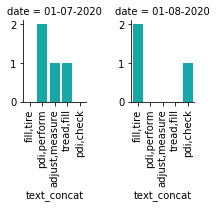
Try this, it seems you were over-writing the 'plot' variable.:

import pandas as pd
import seaborn as sns
import matplotlib.pyplot as plt 
%matplotlib inline

vin = pd.Series(["W1","W1","W2","W2","W1","W3","W4"])
word1 = pd.Series(['pdi','pdi','tread','adjust','fill','pdi','fill'])
word2 = pd.Series(['perform','perform','fill','measure','tire','check','tire'])
date = pd.Series(["01-07-2020","01-07-2020","01-07-2020","01-07-2020","01-08-2020","01-08-2020","01-08-2020"])

bigram_with_dates = pd.concat([vin,word1,word2,date], axis = 1)
names = ["vin", "word1","word2","date"]
bigram_with_dates.columns = names
bigram_with_dates['date'] = pd.to_datetime(bigram_with_dates['date']).dt.strftime('%m-%d-%Y')
bigram_with_dates['text_concat'] = bigram_with_dates['word1'] + "," + bigram_with_dates['word2']

plot = sns.FacetGrid(bigram_with_dates, col="date", height=3, aspect=.5, col_wrap = 10,sharex = False, sharey = False)
plot1 = plot.map(sns.countplot, 
                 'text_concat', 
                 color = 'c', 
                 order = bigram_with_dates['text_concat'].value_counts(ascending = False).iloc[:5].index)\
            .fig.subplots_adjust(wspace=0.5, hspace=12)

for axes in plot.axes.flat:
    _ = axes.set_xticklabels(axes.get_xticklabels(), rotation=90)
plt.tight_layout()

Output:

enter image description here

Advisement answered 5/2, 2020 at 15:55 Comment(2)
thank you for the help, it is much appreciated. This appears to work for me!Occident
One other question I had is that in my figures I would expect the labels should change from one facet to the next given that the there more than 50 categories within the field 'text_concat', but they are the same in each plot. Is there something else I'm missing there. I thought that the order argument would take care of this.Occident
C
0

The solution did not work for me, when I tried something similar, I got the warning:

set_ticklabels() should only be used with a fixed number of ticks, i.e. after set_ticks() or using a FixedLocator.

This solution worked for me:

for ax in plot.axes.flat:
    for label in ax.get_xticklabels():
        label.set_rotation(90)
Charissecharita answered 10/8 at 11:31 Comment(0)

© 2022 - 2024 — McMap. All rights reserved.