What would cause Tomcat (v8) to CPU spike with periodic regularity
Asked Answered
V

2

10

On a windows 2012 RT (x64) TEST server we are running a Tomcat 8 installation and the CPU usage is disconcerting in its regularity of hitting peak usage.

The behavior is happening after an installation of our application but before anyone is accessing it. I have accessed a few pages and tested some features but nothing that could create this behavior that I know of.

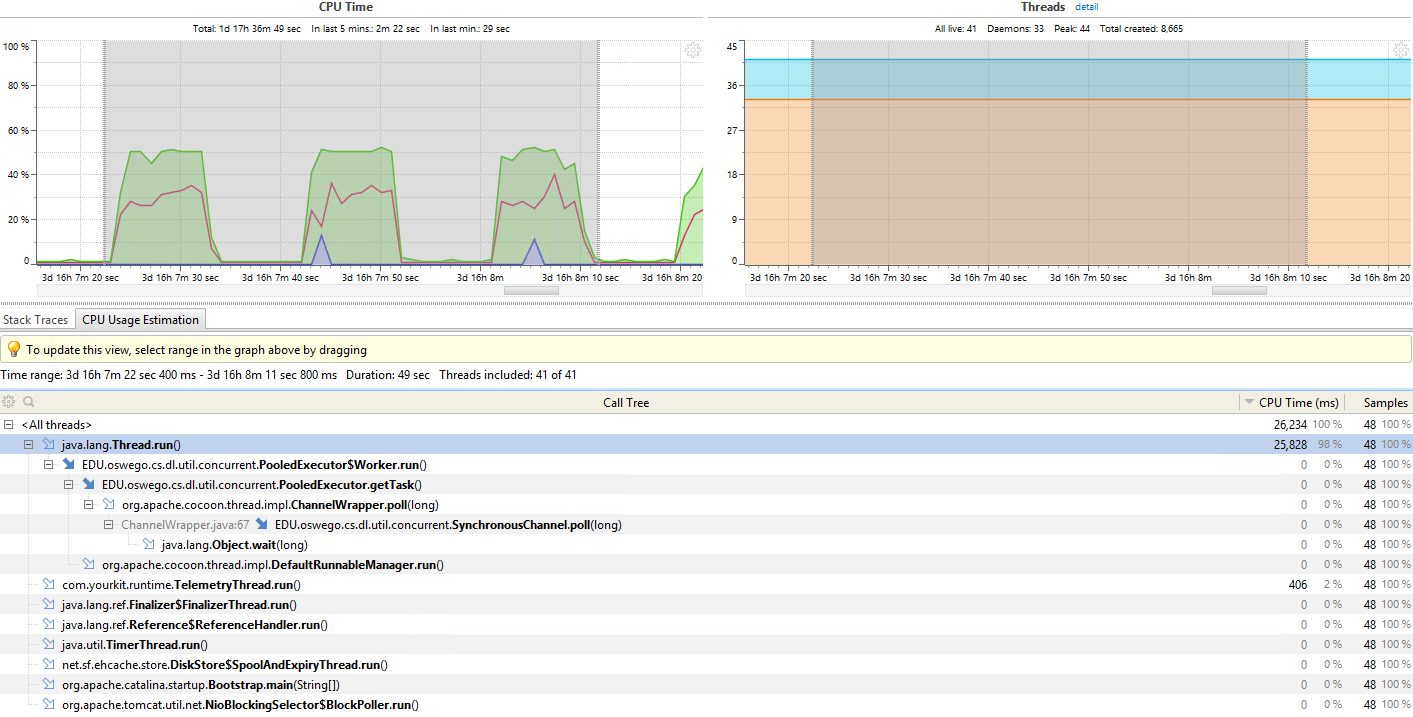
There are 2 virtual processors on the server and every ~20 seconds, the CPU usage will spike (on the one processor that is running Tomcat) to 100% for 10 seconds (give or take). See below:

Graph of periodic spikes

The regularity of the pattern indicates to me that something is incorrect in either the installation or the settings of Tomcat 8.

I have installed the YourKit Java Profiler (by SO recommendation) which I was hoping could shed some light on what is causing these spikes, but haven't been able to see the reason the threads are starting -- at least in part to my newness to YourKit. I did attach it to the Tomcat launch file and it seems to be tracking the behavior.

The catalina logs are silent during the spiking occurrences (as are my application logs) but when I stopped Tomcat there were some messages about ThreadLocals getting started but could not be removed and then: "...Threads are going to be renewed over time to try and avoid a probable memory leak."

I left the server running over the weekend and the pattern has continued until today so I don't think my symptoms are going away. Whatever is starting up has now consumed all available RAM on the system just from starting up these threads (and/or YourKit) every 20 seconds.

What is a possible approach to isolate this aberrant Tomcat activity and hopefully stop or rectify it?

There are many graphs and tabs in YourKit so I hesitate to list everything that might be helpful. Thanks for helping me narrow down the problem with what YourKit (or other tools) could offer me.

Info from catalina log regarding start-up:

Apache Tomcat/8.0.23
Architecture: amd64
Java Home: C:\Program Files\Java\jre1.8.0_65
CATALINA_BASE: C:\Program Files\Apache Software Foundation\Tomcat 8.0

2015-12-08 Update

At Gergely's request, the application is a local installation of DSpace. It's a Java application with a Postgres SQL database backend. We are customizing an opensource version of it from here: http://www.dspace.org/introducing. I'm not exactly sure what else can be helpful and I think the stack trace is more revealing as to what is (and isn't) running -- see below.

By turning on Stack Telemetry in YourKit, "CPU Estimation" was made available by dragging the cursor across a period of profiler history. To me, it looks like all the CPU is doing is spinning idly. Are the Java files pictured below Tomcat routines? They don't strike me as DSpace related (although I'm not an expert) nor does it look like any work is being done while the CPU is peaking.

Of note: the stack trace is identical during the quiet periods -- the only difference being CPU Time (ms) is in the hundreds rather than thousands of milliseconds. For a more direct comparison than what is below, the hump represents ~8,000 ms in Thread.run() and the quiet periods consume ~125 ms of cpu time (although covering approximately the same amount of time).

Lastly, when pages of the application are being requested, a subsequent branch of code appears in the Call Tree. If it happened during the time of a spike it may only take 400 ms of CPU time to load a whole page. The code branch that appears is ApplicationFilterChain.java as a whole separate branch alongside PooledExecutor$Worker.run() -- both underneath java.lang.Thread.run() in the hierarchy.

When trying to interpret the stack trace: Is EDU.oswego.cs.dl.util.concurrent.PooledExecutor$Worker.run() responsible?

Processor spikes with no known, associated activity

CPU Profiling

2015-12-08 Update #2

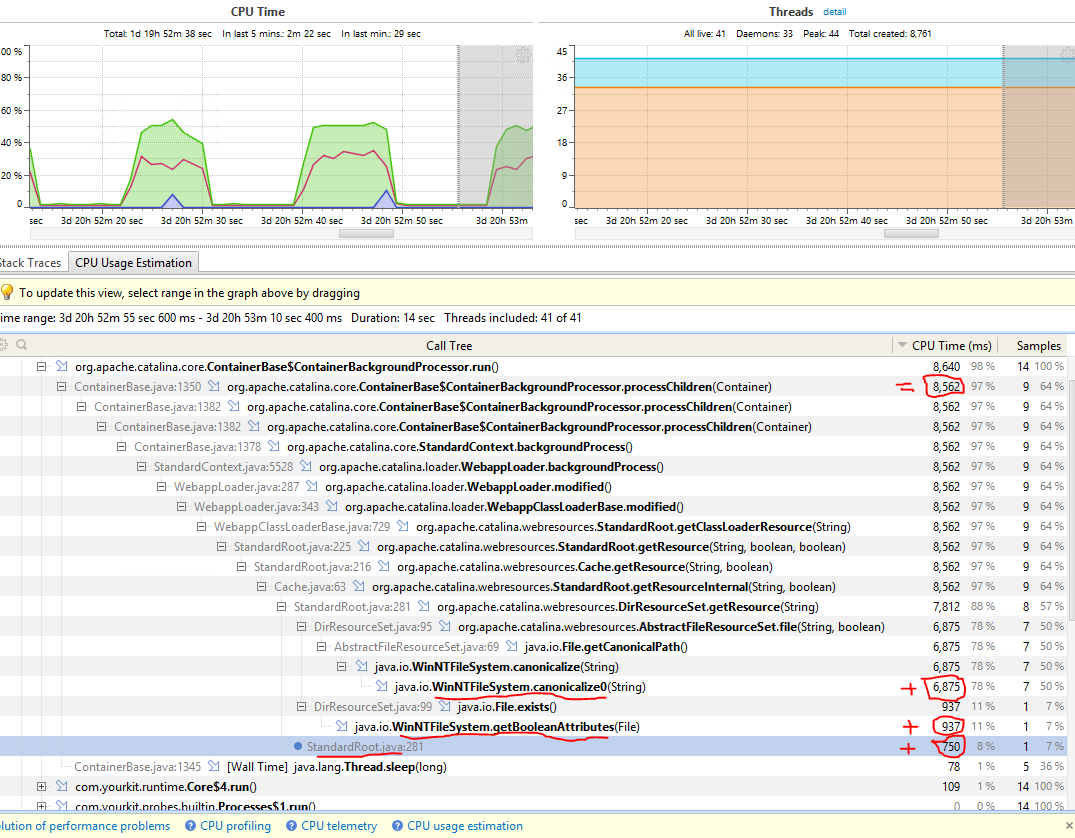
YourKit comes pre-configured to hide certain java class name patterns which obscured drilling down on java.lang.Thread. Clearing the filters enabled the following screenshots showing that the vast majority of processing time during a spike event is through calling the following 3 methods:

  • java.io.WinNTFileSystem.canonicalize0
  • java.io.WinNTFileSystem.getBooleanAttributes (inFile.exists())
  • StardardRoot.java

My apologies for not yet knowing enough about Tomcat or DSpace to know who is launching these tasks. (In case it matters the line directly above the first line is java.lang.Thread.run() and then <All threads>)

better stack trace

Viccora answered 7/12, 2015 at 16:49 Comment(6)
Take some thread dumps while the CPU usage is high.Dogtooth
It is unlikely that this is Tomcat acting up. Can you tell us anything about the application you have deployed on the server?Wight
Do you have any cron jobs running that are changing/reindexing DSpace items? Those would be hitting Solr, which would then cause extra activity.Monolith
@schweerelos, thank you for the idea -- I had considered and looked for that. There are scheduled tasks but I do not believe they are running. This on-again, off-again pattern extends itself so repeatedly and with such regularity that does not occur when re-indexing is launched. The resource usage appearance is entirely different and 'irregular' -- not periodic. There are also logs that are made when real indexing is happening which I do not see during these spiked periods.Viccora
@GergelyBacso, does the update in my post give any insights on whether Tomcat or my application is causing these spikes? Thank youViccora
@MarkThomas - thank you for your recommendation and participation in the discussion. The answer to calming the symptomatic CPU behavior has been answered.Viccora
V
15

Thank you to those who has viewed and responded to this inquiry. As various individuals have surmised, the problem was related to our settings and use of Tomcat -- not a problem with Tomcat itself (most likely).

This is an attempt to answer the question without perfect knowledge at installing the DSpace application and Tomcat but I think I know enough to be dangerous and potentially helpful to follow-up users.

When installing the application DSpace there are some installation properties in Tomcat's configuration directories that determine whether or not to allow for changes in coding files to be reflected immediately without a Tomcat restart. These settings for us were previously in the directory [tomcat]/conf/Catalina/localhost/ and each of the three files contained a small, insignificant XML file like (e.g. oai.xml):

<?xml version='1.0'?>
<Context docBase="E:/dspace/webapps/oai"
    reloadable="false"
    cachingAllowed="true"/>

You can find documentation on these properties at the following link: https://wiki.duraspace.org/display/DSDOC5x/Installing+DSpace

Within that documentation is a recommendation about the reloadable and cachingAllowed properties. Search for "Tomcat Context Settings in Production". Here is an excerpt (emphasis mine):

These settings are extremely useful to have when you are first getting started with DSpace, as they let you tweak the DSpace XMLUI (XSLTs or CSS) or JSPUI (JSPs) and see your changes get automatically reloaded by Tomcat (without having to restart Tomcat). However, it is worth noting that the Apache Tomcat documentation recommends Production sites leave the default values in place (reloadable="false" cachingAllowed="true"), as allowing Tomcat to automatically reload all changes may result in "significant runtime overhead".

It is entirely up to you whether to keep these Tomcat settings in place. We just recommend beginning with them, so that you can more easily customize your site without having to require a Tomcat restart. Smaller DSpace sites may not notice any performance issues with keeping these settings in place in Production. Larger DSpace sites may wish to ensure that Tomcat performance is more streamlined.

When I switched these boolean flags to reloadable="false" and cachingAllowed="true" the spiked CPU experience stopped immediately. I don't know if the warning about "Larger sites" applies to us or whether "streamlined performance" could refer to the negative activity I observed.

I presume there may be other problems with our installation that allowed this particular manifestation; one ominous clue is that our production server seems to be operating with these flags in the reloadable="true" configuration. Java, Tomcat, Windows, AND DSpace are ALL getting new versions at the same time so it is fairly difficult to pinpoint why similar Tomcat <context> settings produce such different results.

I am at least content for now to have new behavior and that the system has calmed down. I'll post more if I learn more but will be focusing next on other quandaries.

Update

FWIW, the attributes are settings that directly control Tomcat and they have changed between versions. E.g., cachingAllowed was removed in version 8 which means it can be removed from the Context elements. Compare:

https://tomcat.apache.org/tomcat-8.0-doc/config/context.html#Attributes https://tomcat.apache.org/tomcat-7.0-doc/config/context.html#Attributes

And for good measure, here is the help text for reloadable in the Tomcat 8 documentation:

Set to true if you want Catalina to monitor classes in /WEB-INF/classes/ and /WEB-INF/lib for changes, and automatically reload the web application if a change is detected. This feature is very useful during application development, but it requires significant runtime overhead and is not recommended for use on deployed production applications. That's why the default setting for this attribute is false. You can use the Manager web application, however, to trigger reloads of deployed applications on demand.

So it would seem that the ultimate answer is that Tomcat 8 on Windows 2012-R2 with the flag reloadable='true' polls for changes to WEB-INF/lib and WEB-INF/classes. The volume of the folders and files to peruse may very well be the cause of these intense, spiked CPU events. For now I will be relying on reloadable='false' which definitely removes the symptom for us.

Viccora answered 9/12, 2015 at 20:56 Comment(3)
Hrrrrrr! I should have caught this one! Tomcat context reload-check is really configured for 10 seconds! Hrrr. I guess it has a huge effect on your performance graph because of the huge amount of data your project has. Nice catch. Congrats.Wight
Thanks @GergelyBacso -- hopefully this will be a good question for future CPU profiling issues. Yes some parts of the project are very large and pruning out potentially unnecessary things would probably be good at some point! Glad we could all learn somethingViccora
I just have this line <Context reloadable="true"> in a custom context.xml.I am not sure what it is referring to.Any idea ? Thanks,Copartner
W
1

Not an explicit answer, but way too long for a comment

After reviewing the update on this question and reading a bit I suspect that this recurring issues is caused by a CuratorTask. Reasons being:

  • The stacktrace you acquired clearly shows that a WorkerThread managed by the DSpace library (so Tomcat is not to be blamed) is using the processor at those times.

  • After reading a bit about DSpace itself, it looks like that it has a feature that allows users to define curator tasks that should be periodically executed.

  • On top of this there is at least one task that is - according to the documentation - It is activated by default, so theoretically there can be any number of tasks activated by default.

  • Moreover this conversation reveals at least 1 curation task that is actived every 10 seconds.

All these together point to the same direction. I would suggest using the UI of DSpace (probably in Admin mode) to look around and find the active curation tasks and verify if their scheduling corresponds to what you have observed.

Wight answered 8/12, 2015 at 18:46 Comment(4)
Gergely, thank you for this analysis and your suggestions. I haven't thought of the curated tasks and haven't yet disproven it so will keep learning about those. I uploaded a new screenshot, though, which shows what java steps are active and peaking the CPU but maybe not what initiated them. Since those threads originate from org.apache... doesn't that mean Tomcat is responsible? Or can we safely assume work underneath java.lang.Thread.run() was started by DSpace (which is the line directly above the first line in the screenshot)?Viccora
Those highlighted functions above are dealing with FileResources. Yes, Apache loads them for sure, but I think it loads them because it is requested by those curator tasks. I mean if my hypothesis is right, then those curator tasks need to operate on some data. Still not sure about any of this of course. Haven't seen this system before.Wight
Before I forget I wanted to mention that I ran my own curation task from the administrative side and it generated some log notes which isn't happening during the periodic CPU spikes. This may not be enough evidence to prove a negative, just more info. Nice research, though, in a system you've never seen!Viccora
Thanks so much for your help and recommendation(s). The true answer has been discovered and posted.Viccora

© 2022 - 2024 — McMap. All rights reserved.