Using the following small dataset:
bill = [34,108,64,88,99,51]
tip =  [5,17,11,8,14,5]
I calculated a best-fit regression line (by hand).
yi = 0.1462*x - 0.8188 #yi = slope(x) + intercept
I've plotted my original data using Matplotlib like this:
plt.scatter(bill,tip, color="black")
plt.xlim(20,120) #set ranges
plt.ylim(4,18)

#plot centroid point (mean of each variable (74,10))
line1 = plt.plot([74, 74],[0,10], ':', c="red")
line2 = plt.plot([0,74],[10,10],':', c="red")

plt.scatter(74,10, c="red")

#annotate the centroid point
plt.annotate('centroid (74,10)', xy=(74.1,10), xytext=(81,9),
        arrowprops=dict(facecolor="black", shrink=0.01),
        )

#label axes
plt.xlabel("Bill amount ($)")
plt.ylabel("Tip amount ($)")

#display plot
plt.show()
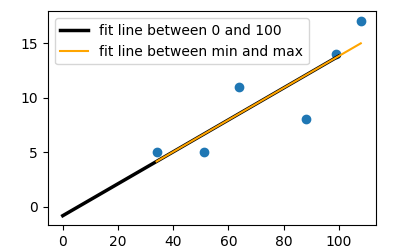
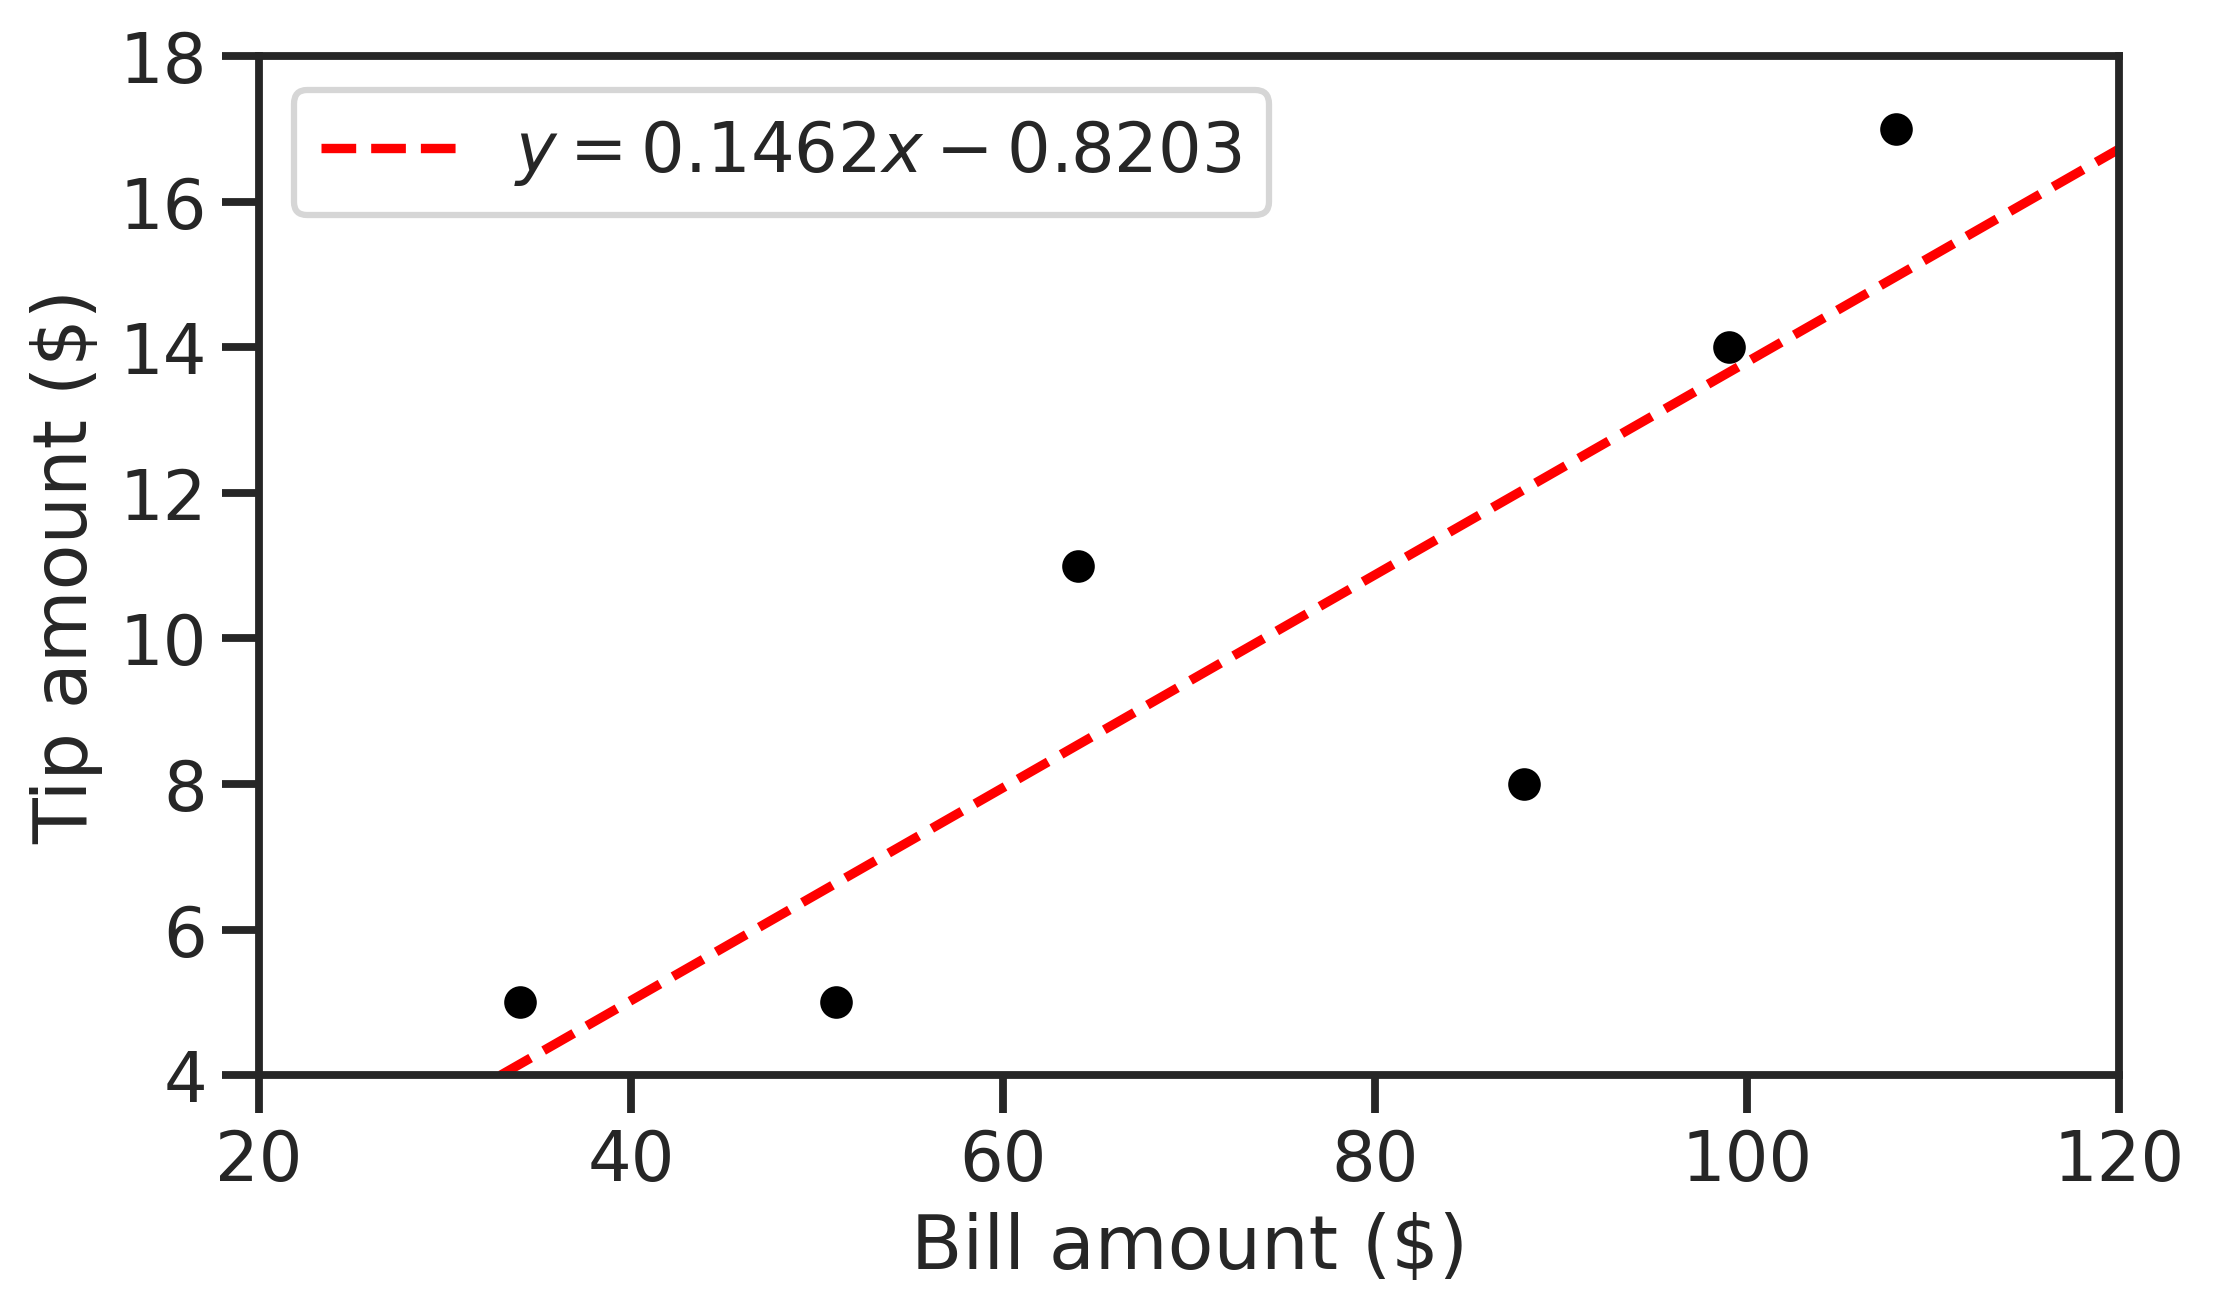
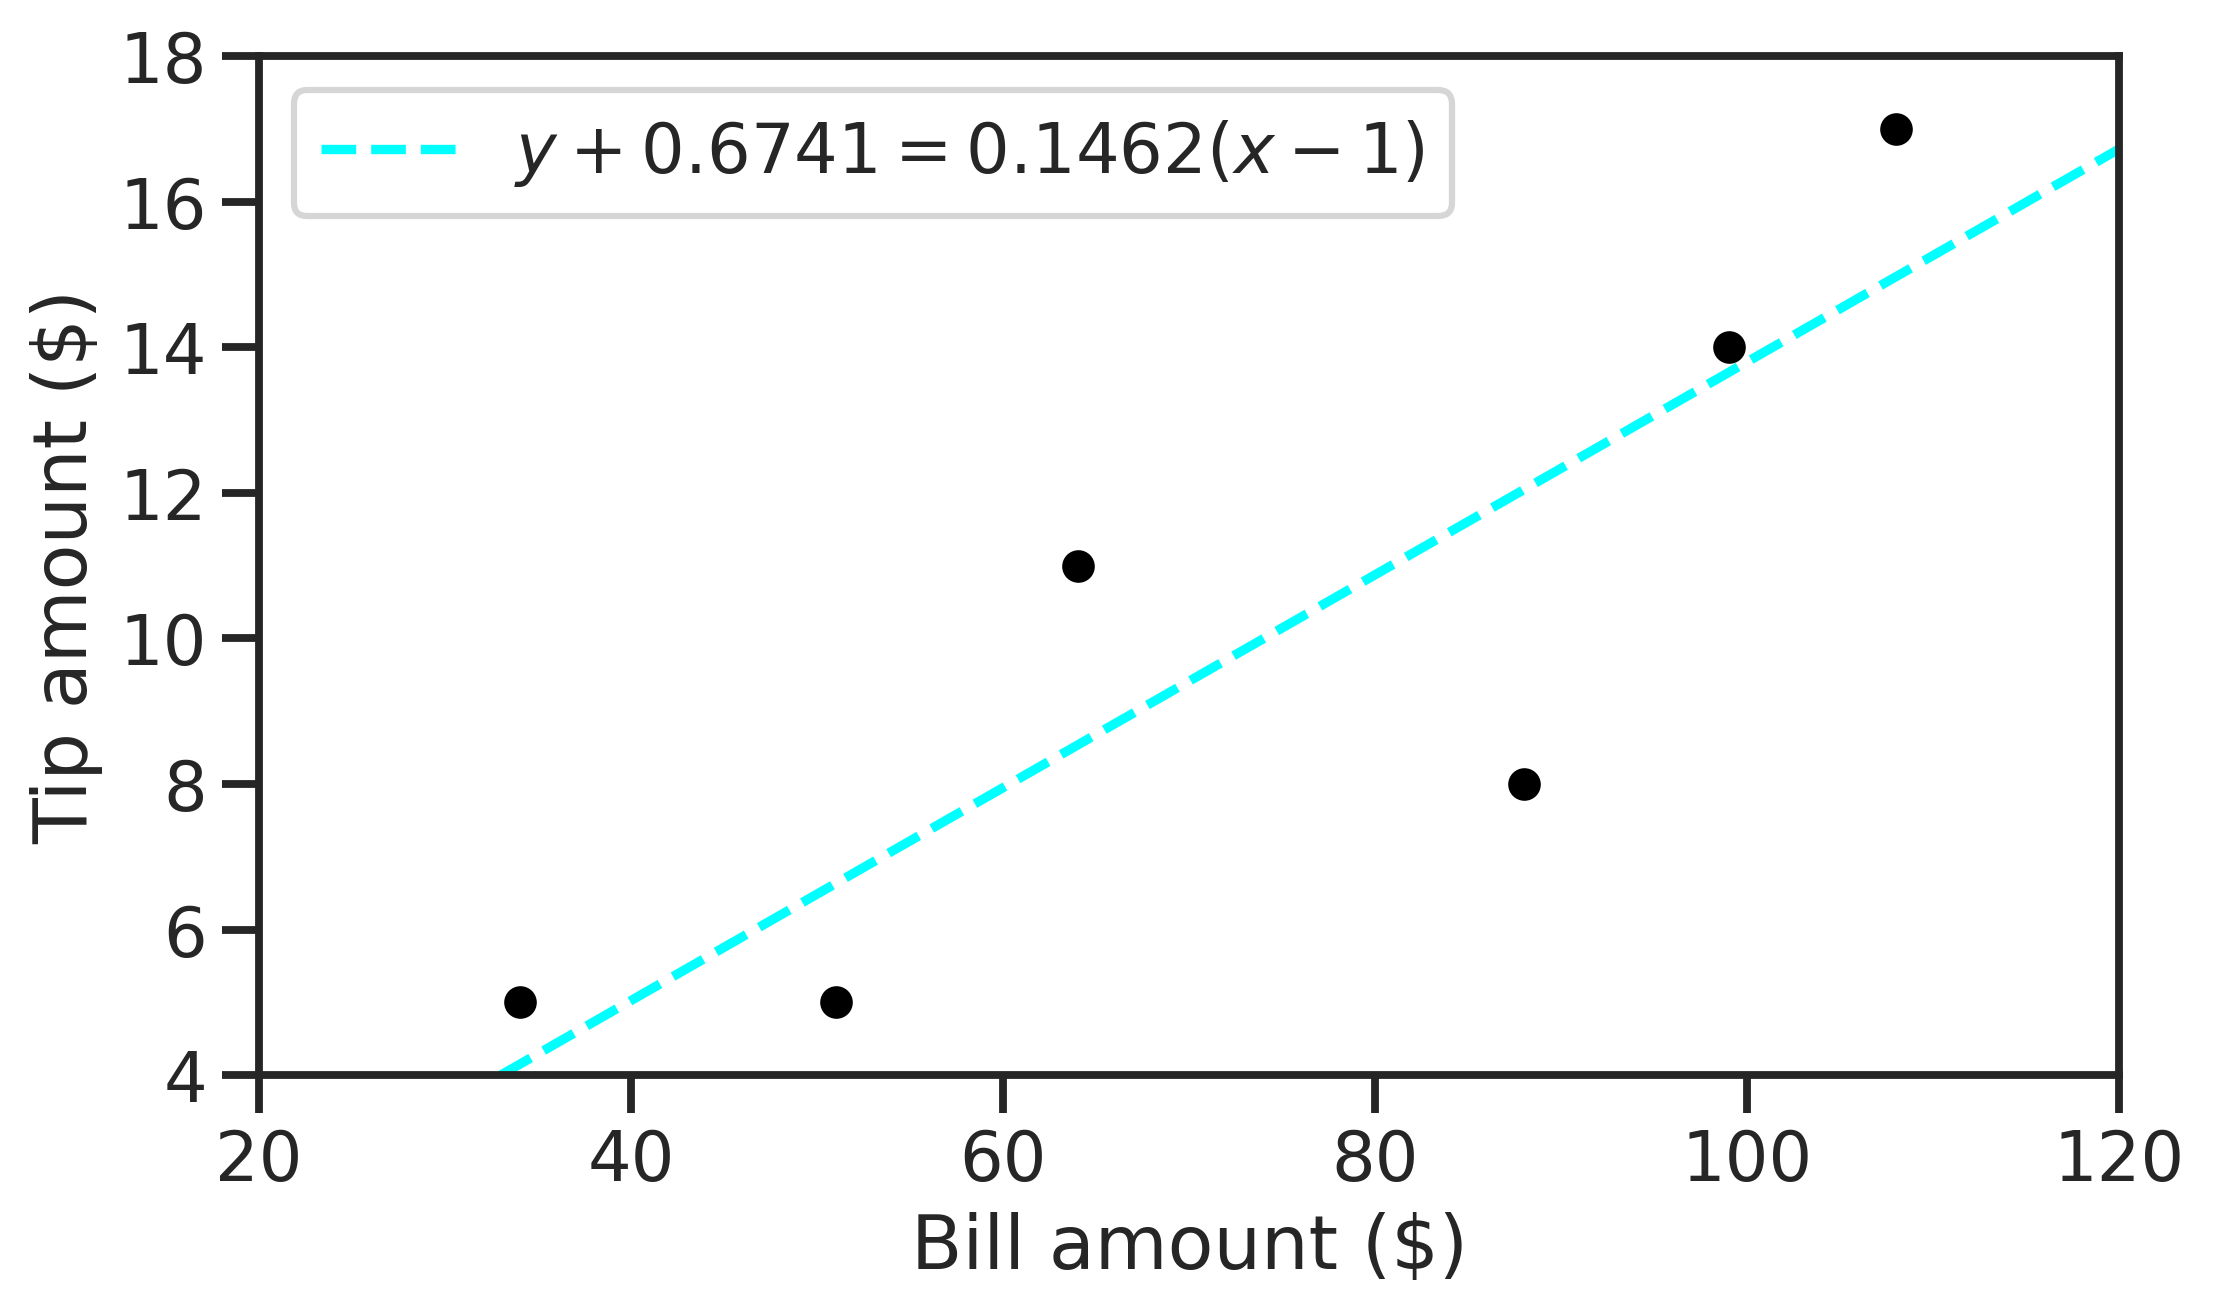
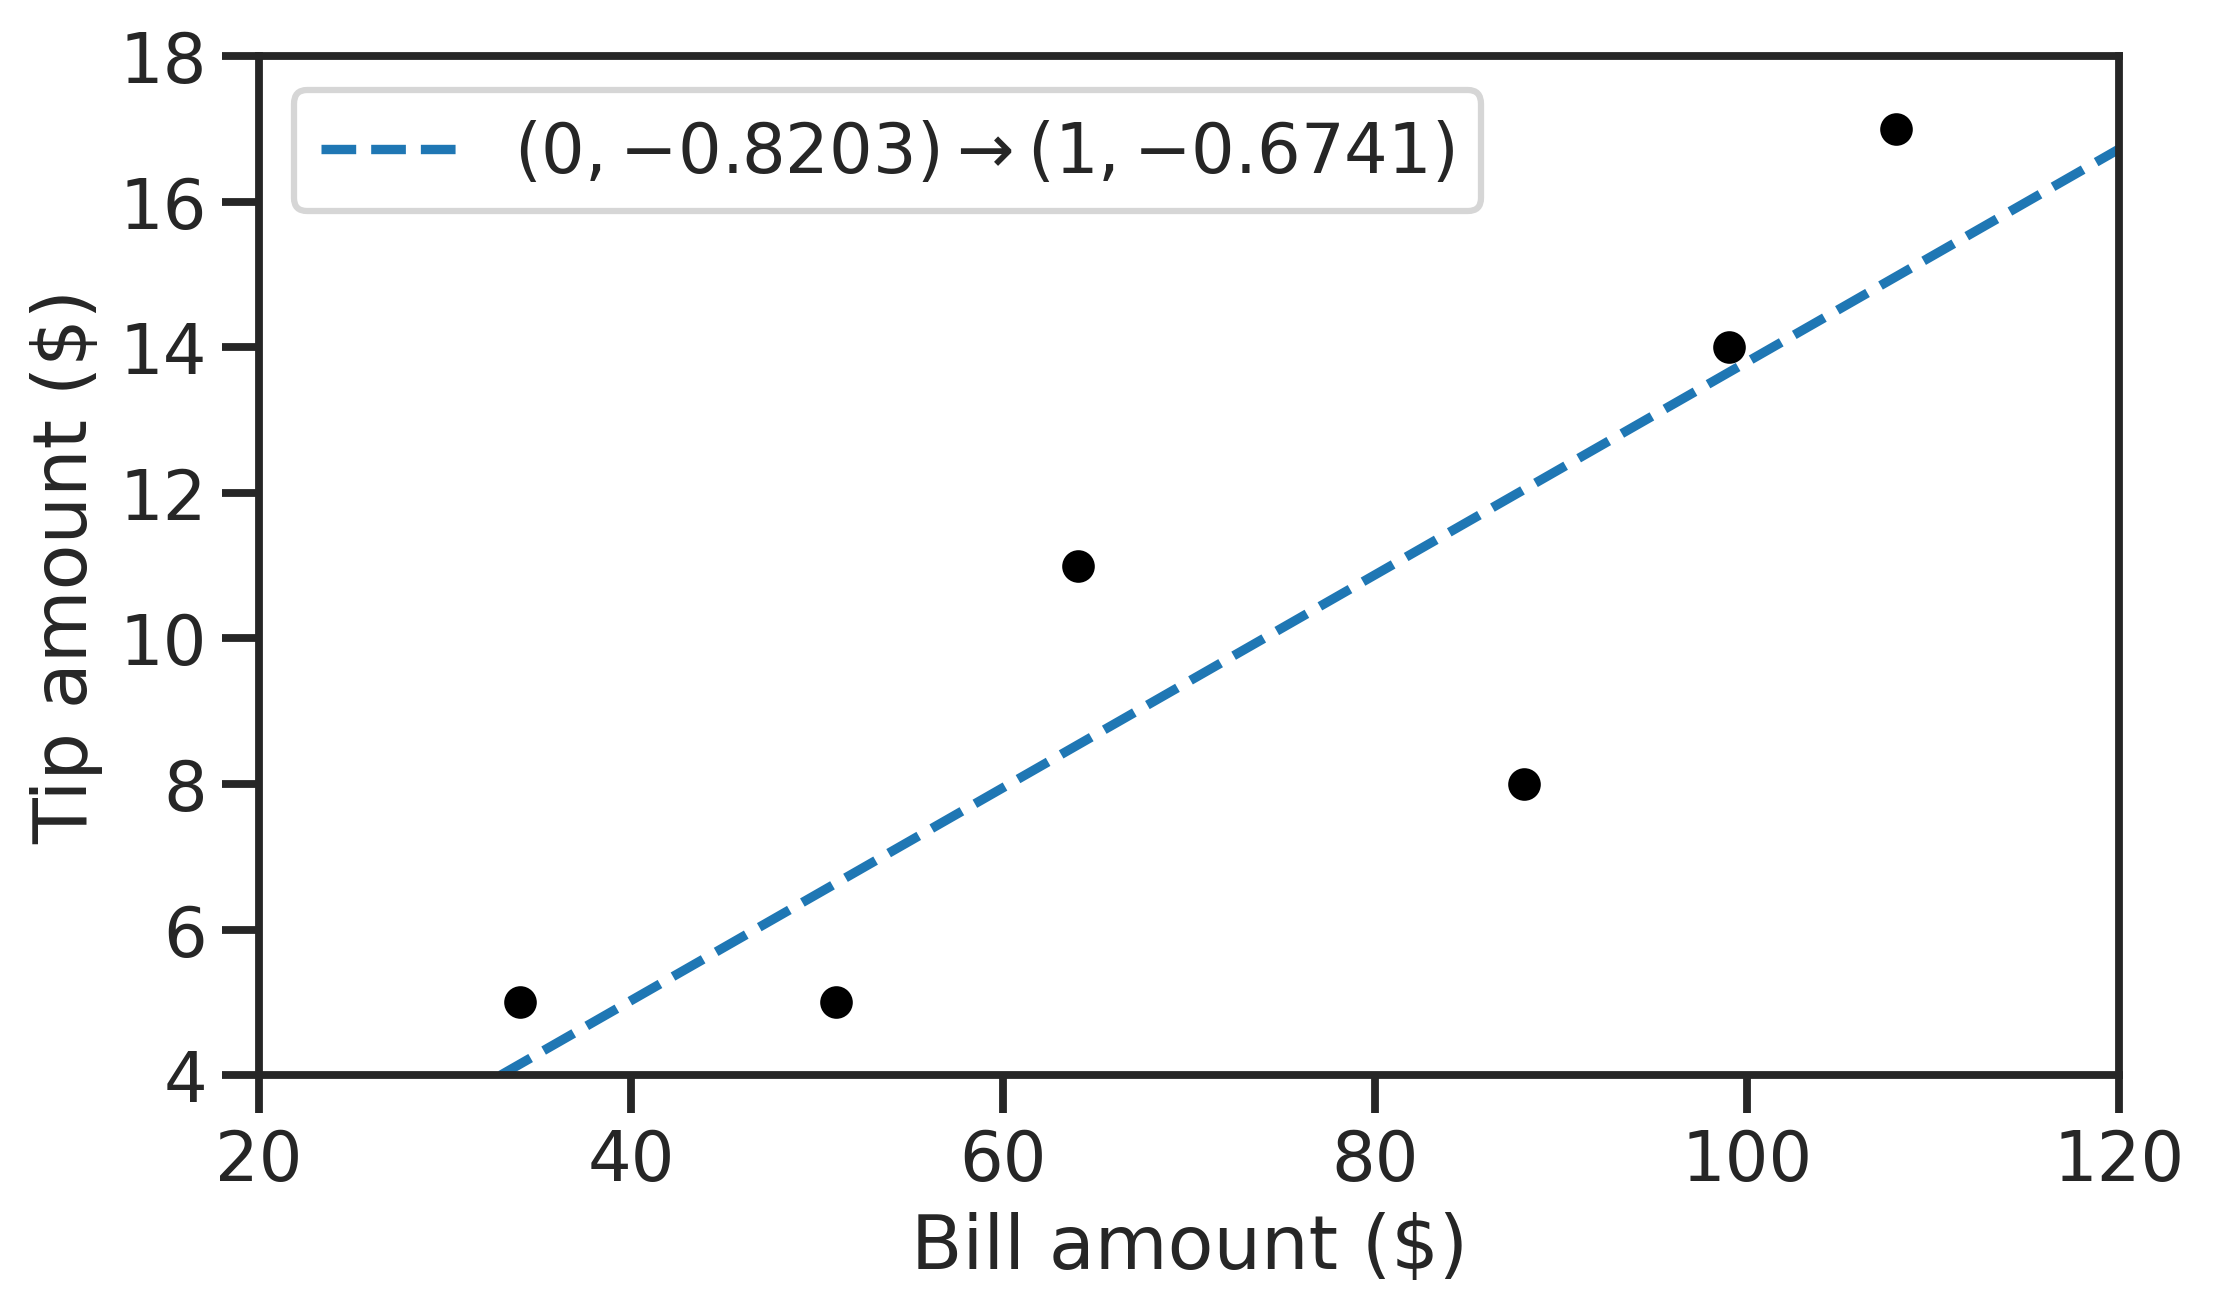
I am unsure how to get the regression line onto the plot itself. I'm aware that there are plenty of builtin stuff for quickly fitting and displaying best fit lines, but I did this as practice. I know I can start the line at points '0,0.8188' (the intercept), but I don't know how to use the slope value to complete the line (set the lines end points).
Given that for each increase on the x axis, the slope should increase by '0.1462'; for the line coordinates I tried (0,0.8188) for the starting point, and (100,14.62) for the end point. But this line does not pass through my centroid point. It just misses it.


