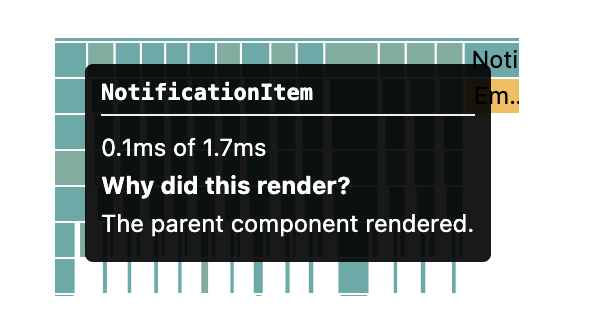
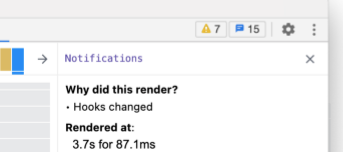
I am reading this article about profiling React applications: Optimize slow React components and in the Profiler you can see "Why did this render" in the tooltip and sidebar:
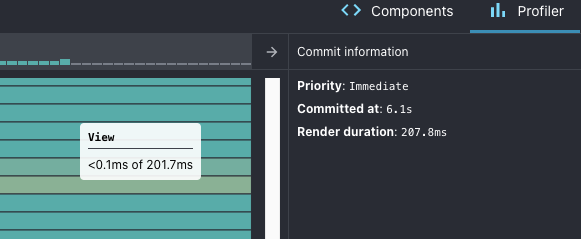
Where as in my profiler there is no such information. I am using the latest version of React Native Debugger:
How can I see / display this information?


