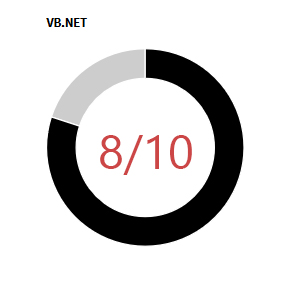
I am using the google charts library to create donut charts. I wanted to know if it was possible to add a label in the middle of my donut chart just as this:

I checked in the google description of options and couldn't find anything. here is how i generate my charts.
<script type="text/javascript" src="https://www.gstatic.com/charts/loader.js"></script>
<script type="text/javascript">
    google.charts.load("visualization", "1", {packages:["corechart"]});
    google.charts.setOnLoadCallback(init);
    function drawChart(myID,titler,known,unknown) {
        var data = google.visualization.arrayToDataTable([
          ['Knowledge', 'Out of 10'],
          ['Known',     known],
          ['Unknown',      unknown]
        ]);
        var options = {
          title: titler,
          pieHole: 0.7,
          colors: ['#000000', '#cdcdcd'],
          pieSliceText: 'none',
          legend:{position: 'none'},
          tooltip:{text:'percentage'},
          tooltip:{textStyle:{fontSize: 12}}
        };

        var chart = new google.visualization.PieChart(document.getElementById(myID));
        chart.draw(data, options);
      }
      function init(){
          drawChart('donutchart1','VB.NET',8,2);
          drawChart('donutchart2','Javascript',4,6);
      }
</script>
And my HTML to style my output:
    <table class="Charts">
        <tr>
            <td><div id="donutchart1" style="width: 256px; height: 256px;"></div></td>
            <td><div id="donutchart2" style="width: 256px; height: 256px;"></div></td>
        </tr>
    </table>
