matplotlib latex in legend label vs in axis label
Asked Answered
O

1

10

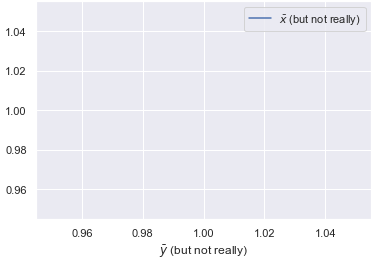
For matplotlib, you can label legends and axis labels using tex command syntax. You're supposed to prepend r to the string: r"my tex label". But what I don't understand is why the legend label doesn't care and yet the axis label does care.

Why do the axis labels behave differently than the legend label (or vice versa)?

MWE1 - Crashes

## Hello World! I crash!
import numpy as np
import matplotlib.pyplot as plt
x = np.ones(5)
plt.plot(x, x, label="$\bar{x}$ (but not really)")
plt.xlabel("$\bar{y}$ (but not really)") # I cause the crash
plt.show()

MWE2 - Doesn't Crash

import numpy as np
import matplotlib.pyplot as plt
x = np.ones(5)
plt.plot(x, x, label="$\bar{x}$ (but not really)") # I still don't need prepended r
plt.xlabel(r"$\bar{y}$ (but not really)")
plt.show()
Omasum answered 20/3, 2017 at 21:13 Comment(2)
matplotlib docs: Rendering math equations using TeXMerocrine
LATEX Mathematical SymbolsMerocrine
A
17

That's no fair comparison. The plot label from MWE2 get's never used, because there is no legend; therefore it will not raise any error. Once you produce this legend using plt.legend() it will of course cause the same kind of error that you'd expect from all other strings that contain MathText commands and are no raw strings.

This crashes:

import numpy as np
import matplotlib.pyplot as plt
x = np.ones(5)
plt.plot(x, x, label="$\bar{x}$ (but not really)") 
plt.xlabel(r"$\bar{y}$ (but not really)")
plt.legend()
plt.show()

Result:

ValueError: 
$ar{x}$ (but not really)
^
Expected end of text, found '$'  (at char 0), (line:1, col:1)

This does not crash, as all strings are raw strings

import numpy as np
import matplotlib.pyplot as plt
x = np.ones(5)
plt.plot(x, x, label=r"$\bar{x}$ (but not really)") 
plt.xlabel(r"$\bar{y}$ (but not really)")
plt.legend()
plt.show()

enter image description here

Arietta answered 20/3, 2017 at 21:22 Comment(1)
You can also escape the backslash so that Python doesn't interpret \b as an ASCII backspace: plt.plot(x, x, label="$\\bar{x}$ (but not really)")Libya

© 2022 - 2024 — McMap. All rights reserved.