Yes, both simulator or device will work.
If you haven't already read, read their getting started tutorials, it covers most of it https://firebase.google.com/docs/analytics/ios/start
A couple of points
- Make sure when you configure your Firestore settings , you enable analytics
AnalyticsConfiguration.shared().setAnalyticsCollectionEnabled(true)
I do all of this initial settings in AppDelegate
something like
//init Firebase
        FirebaseConfiguration.shared.setLoggerLevel(.min)
        FirebaseApp.configure()
        Fabric.with([Crashlytics.self])
        let _ = FirebaseConfig.sharedInstance // This is a custom singelton class where I enable the analytics
- In Scheme settings for your target you need to add
-FIRAnalyticsDebugEnabled
![enter image description here]()
As you can see I have also a disable option there, sometimes analytics goes crazy and spams the console , so I'd like to disable it with . -FIRDebugDisabled
- Analytics clusters your events unless you specify it is a custom event.
For example I use following to tag the viewcontroller names
    func logEvent(eventTitle:String , eventContent:String)
{
    Analytics.logEvent(AnalyticsEventSelectContent, parameters: [
        AnalyticsParameterItemID: "AppName-\(eventTitle)" as NSObject,
        AnalyticsParameterItemName: eventTitle as NSObject,
        AnalyticsParameterContentType: eventContent as NSObject
        ])
}
But int the firestore these are clustered under select_content section because I used AnalyticsEventSelectContent key when creating the log.
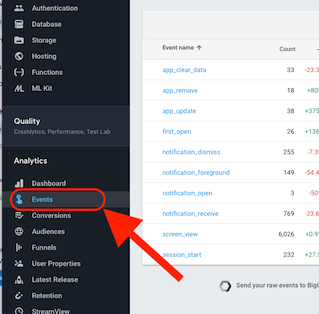
Under main events screen , select_content my view controlers logged with above function
![enter image description here]()
4.There is a specific DebugView in the FirestoreConsole that works with a device, it updates every 60 seconds as long as settings for -FIRAnalyticsDebugEnabled is true in the scheme.
![enter image description here]()
- There is a significant delay in the Event Section of Firestore console, I don't know why this happens, but sometimes there is a delay up to 15 - 30 mins. Havent researched that issue yet, it really doesnt bother me.


