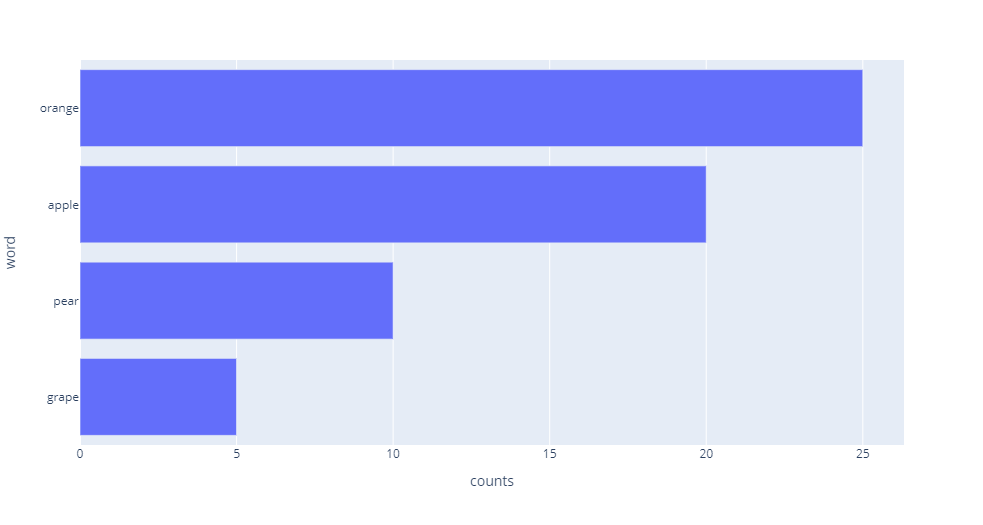
I need to make a plotly bar chart with bars ordered by value in descending order. I first order the dataframe by value in descending order. Then I use plotly.express to generate interactive bar chart. However, I found the bars are still in ascending order. Does anyone know what I did wrong? Thanks a lot for help.
import plotly.express as px
dat = pd.DataFrame({'word': ['apple', 'grape', 'orange', 'pear'],
                     'counts': [20, 5, 25, 10] } )
dat = dat.sort_values('counts', ascending=False)
px.bar(dat, x = 'counts',y='word', orientation='h')

