Mac OS: Leaks Sanitizer
Asked Answered
S

3

10

Mac OS X Sierra 10.13

I do as wrote here https://clang.llvm.org/docs/LeakSanitizer.html

I.e. created the small application with memory leak

#include <stdlib.h>
void *p;
int main() {
  p = malloc(7);
  p = 0; // The memory is leaked here.
  return 0;
}

Then build it and run to test how the memory leak is detected:

admins-Mac:test2 admin$ clang -fsanitize=address -g mleak.c ; ASAN_OPTIONS=detect_leaks=1 ./a.out
==556==AddressSanitizer: detect_leaks is not supported on this platform.
Abort trap: 6
admins-Mac:test2 admin$ 

How I can detect the leak? I need to use it for my large application.

Strode answered 24/11, 2018 at 8:1 Comment(1)
Read this: Leak Sanitizer is not supported by XCode's ClangKarriekarry
H
15

It seems that the Clang/LLVM shipped by Apple does not have -fsanitize=leak support. I fixed it by installing LLVM on Homebrew. A more detailed fix is on gist

$ brew install llvm@8

# Overwritten default Clang
$ echo 'export PATH="/usr/local/opt/llvm/bin:$PATH"' >> .zshrc

$ source ~/.zshrc
$ which clang
/usr/local/opt/llvm/bin/clang
Hypotenuse answered 20/4, 2019 at 22:51 Comment(1)
thanks, it's a issue with apple clang. BTW: to use custom compile in cmake CC=/usr/local/opt/llvm/bin/clang CXX=/usr/local/opt/llvm/bin/clang++ cmake xxxCatamite
J
6

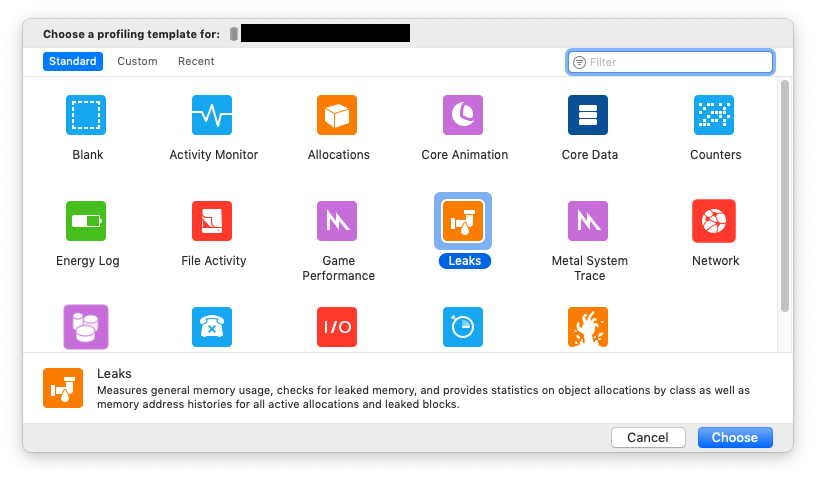
Note that you can also use the Leaks Instrument which ships with Xcode to find leaks in your code without having to install anything extra. It's not very well advertised, but it's a very useful tool. From the "Product" menu, choose "Profile". This may rebuild your application, and it will then launch the Instruments.app. You'll be presented with a sheet of different profiling instruments you can use like this:

The profile chooser for Instruments.app

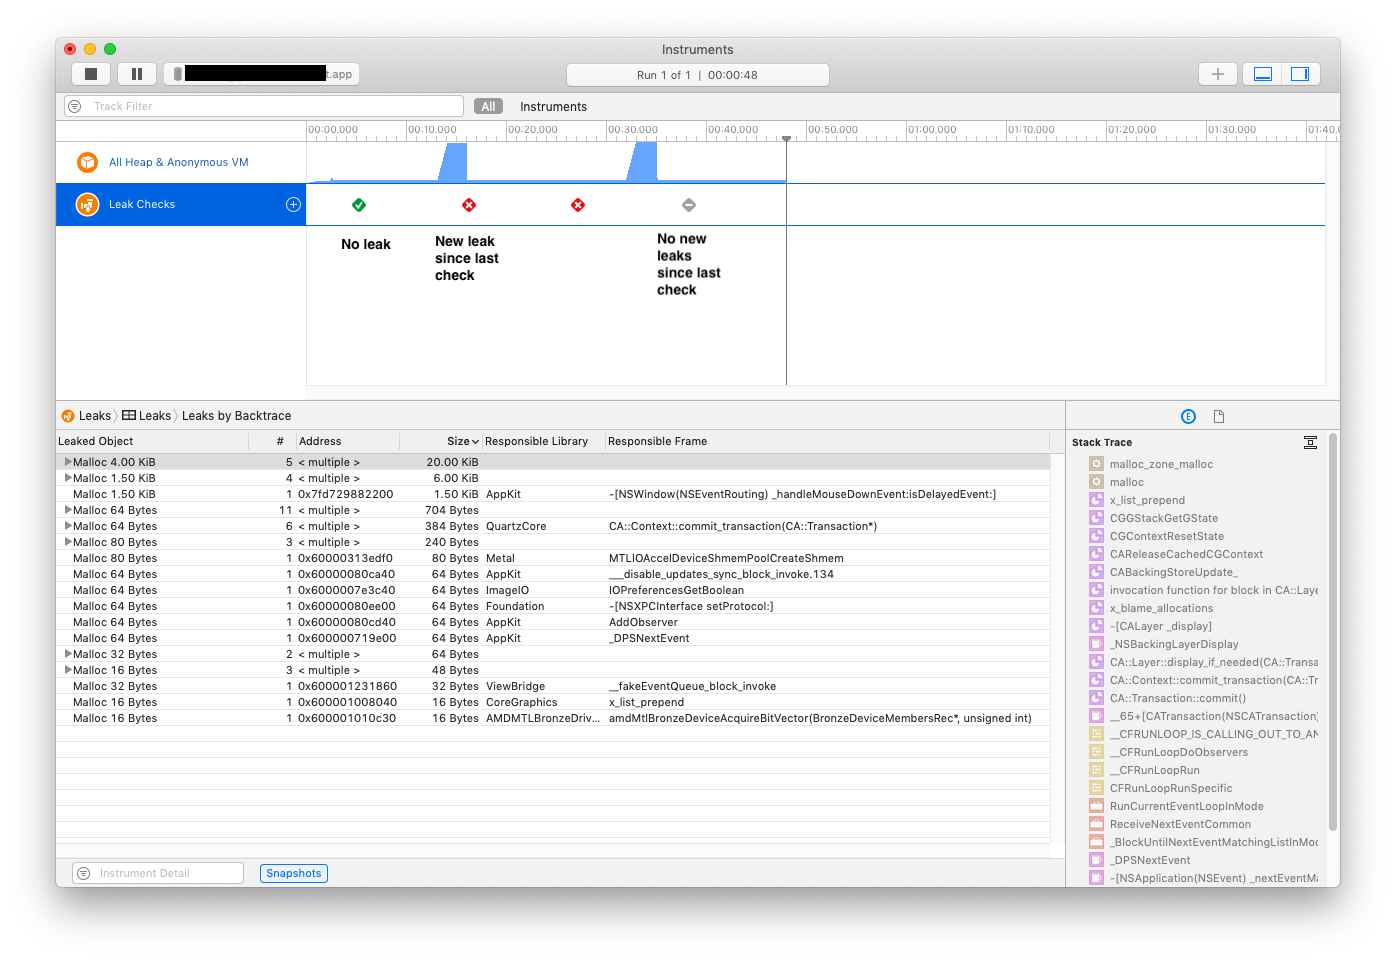
Once you choose it and press the "record" button, it will run your app and display a track showing you any leaks, like this:

The main window of the Leaks instrument in Instruments.app

A green check means no leaks in the app at that time. A red "x" means a new leak since the last check. A gray "-" means there are leaks, but no new ones since the last check. The default is to check every 10 seconds.

At the bottom is a list of the current leaks. If you click on one, you'll see a stack trace on the right showing which function allocated the leaked memory.

This is a very powerful tool that has almost no documentation! I'm not sure why Apple keeps it so hidden.

Jameson answered 17/5, 2019 at 20:58 Comment(2)
Only if it had some suppression list like the LSAN. It catches some false positives too.Perugia
Any idea how to enable this if you have a Makefile project and not a GUI Xcode project?Doublespace
G
0

If you use CLion you can try this setting:

in Preferences | Build, Execution, Deployment | CMake -> Cmake options use

-DCMAKE_BUILD_TYPE=ASAN -DCMAKE_CXX_COMPILER=/usr/local/opt/llvm/bin/clang++

and

enter image description here

Guinna answered 20/10, 2021 at 15:59 Comment(0)

© 2022 - 2024 — McMap. All rights reserved.