How to Debug .NET MAUI Blazor Hybrid Windows UI
Asked Answered
R

2

10

I am basically from web background and trying out .NET MAUI Blazor Hybrid. I am running into errors during development with .NET MAUI Window, but not sure how to debug it? I have looked around all type of windows and cannot find error details anywhere.

I tried debugging, but that is a headspin as it goes into a loop.

image

Rastus answered 1/4, 2022 at 23:44 Comment(1)
For some reason F12 tool was not working, but seems like i can see all the error details nowRastus
A
13

There is a way to "remotely inspect" your app using the browser developer tool (F12). First, check if you added the builder.Services.AddBlazorWebViewDeveloperTools(); in your MauiProgram.cs Run your App and open a new tab in your browser (outside the emulator) and type:

  • For Chrome: chrome://inspect
  • For Edge: edge://inspect
  • For Firefox: about:debugging

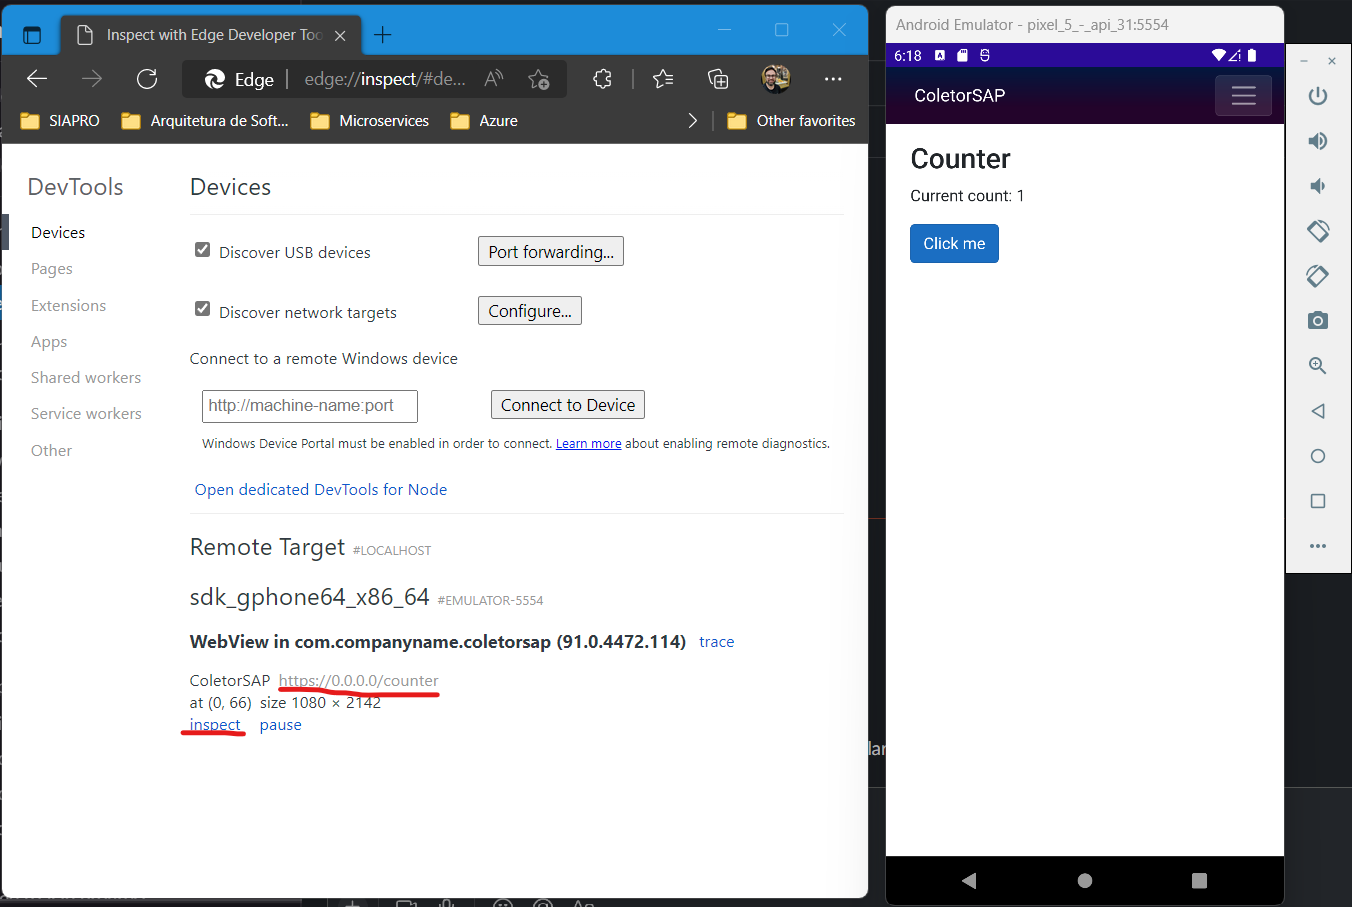
Wait a little and you will see an "inspect" button like below: enter image description here

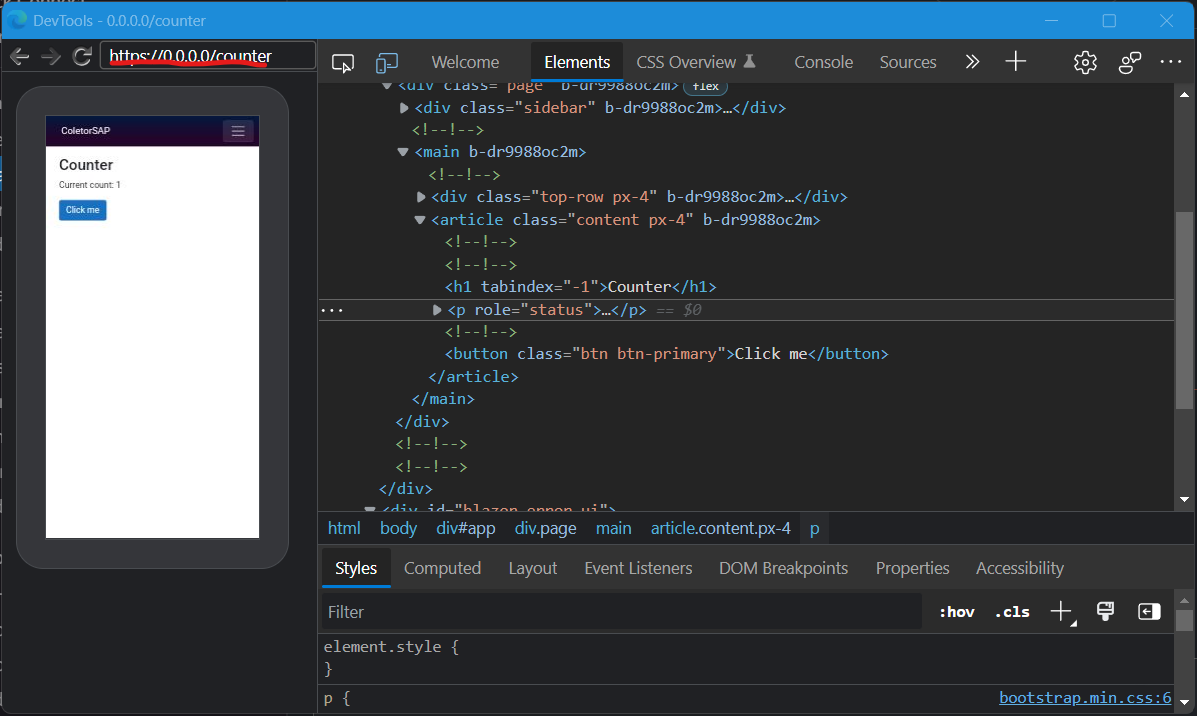
And you can even navigate in your App from there: enter image description here

Acting answered 16/6, 2022 at 21:37 Comment(1)
For iOS on mac try Safari following the docs here: learn.microsoft.com/en-us/aspnet/core/blazor/hybrid/…Pneumatophore
O
11

You have to ensure that the WebDev Tools are activated. Browser developer tools with .NET MAUI Blazor

Ensure the Blazor Hybrid project is configured to support browser developer tools. You can confirm developer tools support by searching the app for AddBlazorWebViewDeveloperTools

If the project isn't already configured for browser developer tools, add support by:

  1. Locating where the call to AddMauiBlazorWebView is made, likely within the app's MauiProgram.cs file.

  2. After the call to AddMauiBlazorWebView, add the following code:

    #if DEBUG
        builder.Services.AddBlazorWebViewDeveloperTools();
    #endif
    

To use browser developer tools with a Windows app:

  1. Run the .NET MAUI Blazor app for Windows and navigate to an app page that uses a BlazorWebView.

  2. Use the keyboard shortcut Ctrl+Shift+I to open browser developer tools.

Outcross answered 15/5, 2022 at 19:50 Comment(1)
Ctrl-Shift-I for inspect, so simple and useful thanks!Pennipennie

© 2022 - 2024 — McMap. All rights reserved.