Create a "thermometer" with color gradient
Asked Answered
A

2

10

I need to create a "thermometer"-looking graph using (hopefully) ggplot2, so that I can place it inside a Shiny app.

Is it even possible to achieve something like this?! In reality, I only need one thermometer per plot, I don't even need more than one. Once I Shiny-fy it, user will change inputs and the thermometer color will change, but the color gradient should always stay consistent.

I just need help getting the initial thermometer done in ggplot2, I'm completely lost on how to do the rounded edges, gradient, icon next to it, etc.

enter image description here

Antemeridian answered 12/4 at 7:21 Comment(2)
Possibly of interest to others who don't need as high-quality a result: #30273548 https://mcmap.net/q/1160869/-plot-thermometer-graphCorena
Also, Hmisc rdrr.io/cran/Hmisc/man/latexTherm.htmlCorena
W
19

You can build a guide extension, which requires ggplot2 3.5.0+. First we need a constructor function that just passes a new parameter max to the guide, which will serve as the level to which the 'mercury' in the thermometer rises.

library(ggplot2)

guide_thermometer <- function(max, ...) {
  new_guide(
    max = max,
    ..., # Other parameters that colourbars accept
    super = GuideThermometer
  )
}

Next we need a new guide class. Below, we're inheriting from the colourbar guide, registering the max parameter and tweaking the build_decor() method. The gist of the tweak is that we're re-using the colourbar guide's method of building the gradient and then using a rounded rectangle to clip the gradient (and also serve as a frame).


GuideThermometer <- ggproto(
  "GuideThermometer", GuideColourbar,
  
  # Registering the 'max' parameter as valid
  params = c(GuideColourbar$params, list(max = NULL)),
  
  build_decor = function(decor, grobs, elements, params) {
    # Setting the 'mercury level'
    if (!is.null(params$max)) {
      decor$colour[decor$value > params$max] <- NA
    }

    # Re-use the coloubar method to build gradient
    grobs <- GuideColourbar$build_decor(decor, grobs, elements, params)

    # Make a rounded rectangle
    rounded <- grid::roundrectGrob(
      r = unit(0.5, "snpc"), 
      gp = grid::gpar(fill = NA)
    )

    # Replace the frame with rounded rectangle
    grobs$frame <- rounded
    # Use rounded rectangle as a clipping path
    grobs$bar <- grid::editGrob(
      grobs$bar,
      vp = grid::viewport(clip = rounded)
    )
    grobs
  }
)

Lastly, you can use the new guide like below. Adding the smiley is just a matter of setting the right breaks and label in the scale.

ggplot(mpg, aes(displ, hwy, colour = cty)) +
  geom_point() +
  scale_colour_viridis_c(
    guide = guide_thermometer(max = 25),
    breaks = 25, label = "\u263a"
  ) +
  theme(legend.text = element_text(size = 16))

Created on 2024-04-12 with reprex v2.1.0

Disclaimer: I have no idea how this will pan out in shiny. Might need to use a device that supports the graphics features introduced in R 4.1.0, I think, due to the clipping path.

Westing answered 12/4 at 7:48 Comment(1)
Thanks!! I only need the thermometer, though – that's going to be my actual plot, it's not supposed to be the legend. I wonder if I can still use this method in any case? I hadn't heard about guide classes.Antemeridian
G
13

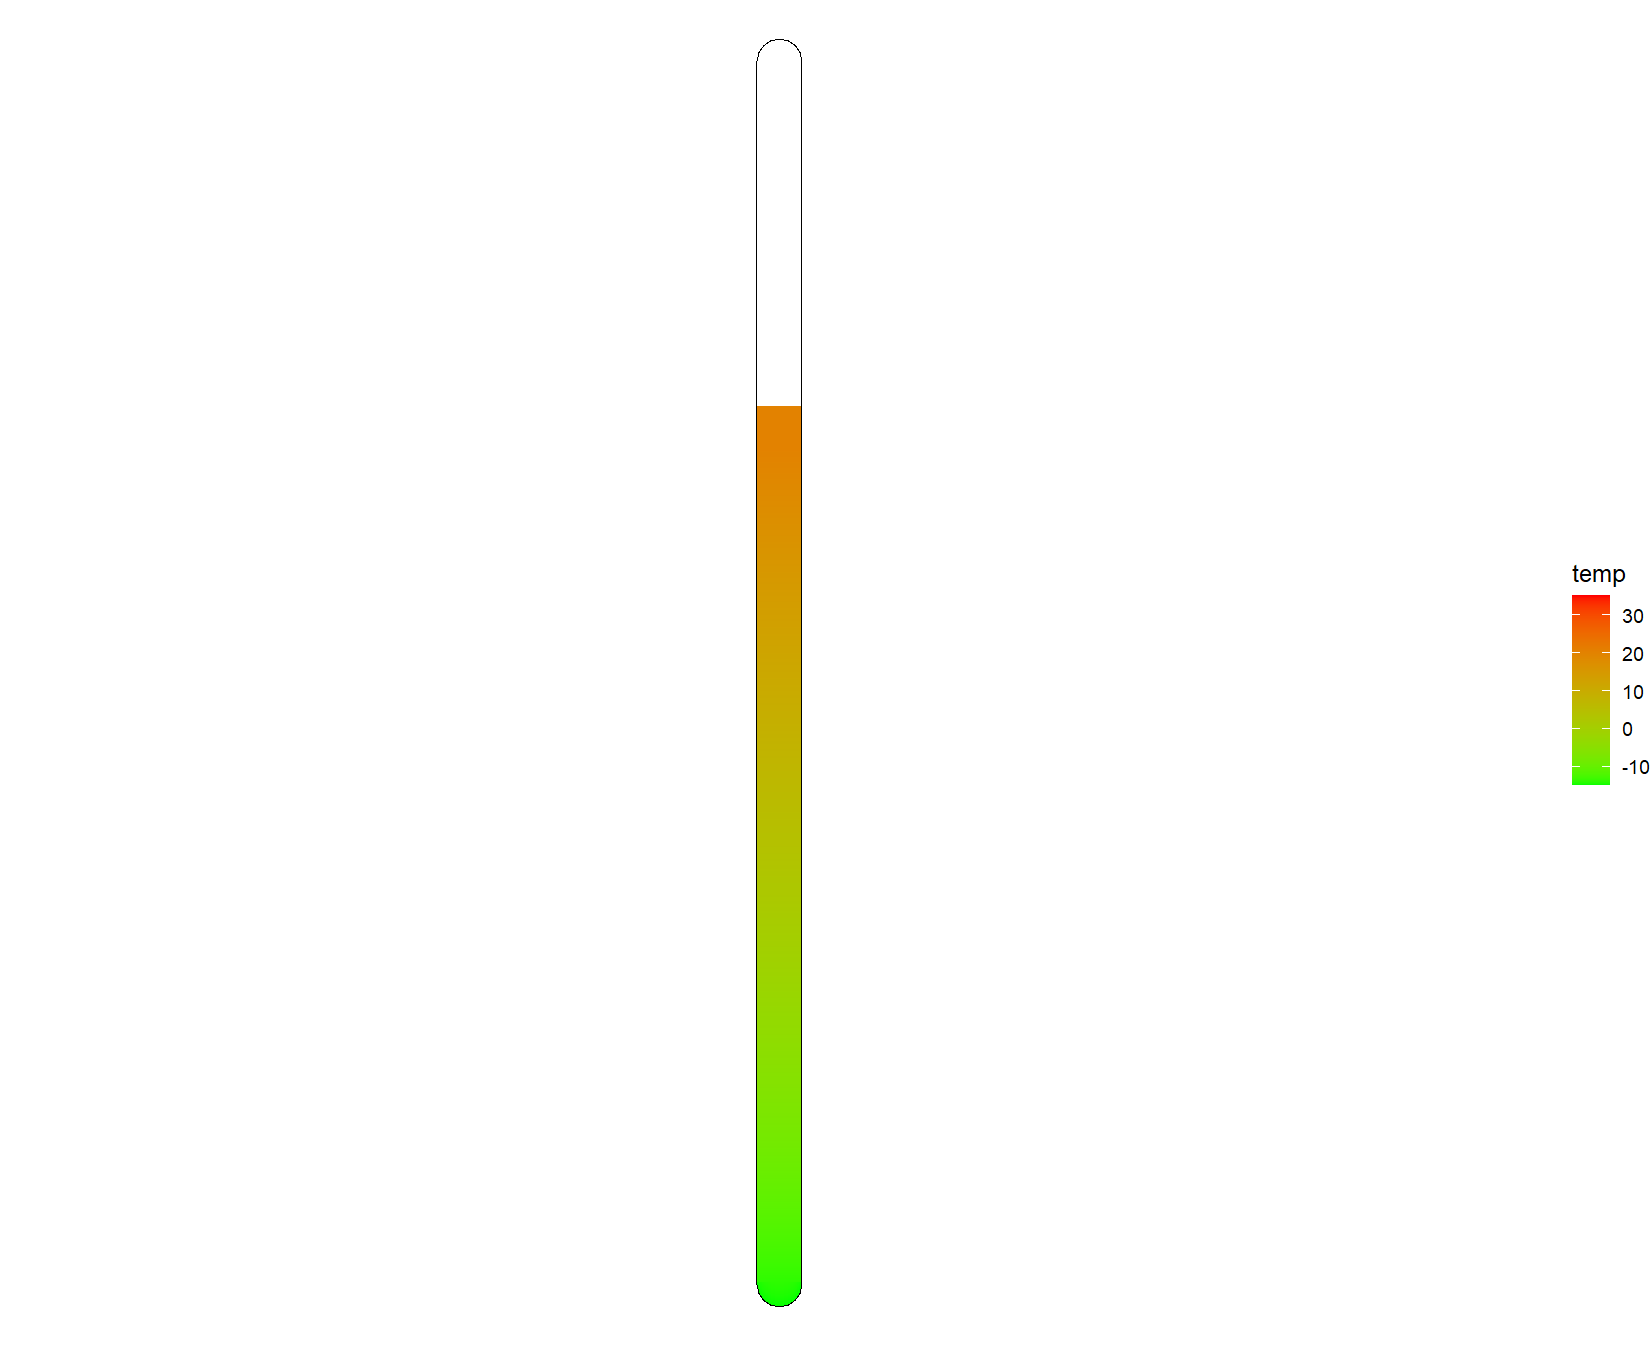
You can create a quick-and-dirty thermometer with geom_segment:

library(ggplot2)
library(data.table)
temp <- 20
temps <- data.table(temp = seq(from = -15, to = temp, by = 0.01))
temps[, temp1 := shift(temp, 1)]


ggplot(temps, aes(x = 1)) +
  geom_segment(aes(y = -15, yend = 35), linewidth = 10, lineend =  c("round"), color = "black") +
  geom_segment(aes(y = -15, yend = 35), linewidth = 9.5, lineend =  c("round"), color = "white") +
  geom_segment(data = temps[1:100], aes(y = temp, yend = temp1, color = temp), lineend =  c("round"), linewidth = 9.5) +
  geom_segment(data = temps[-(1:100)], aes(y = temp, yend = temp1, color = temp), lineend =  c("square"), linewidth = 9.5) +
  scale_color_gradient(low = "green", high = "red", limits = c(-15, 35)) +
  theme_void()

resulting plot

Grimes answered 12/4 at 8:2 Comment(0)

© 2022 - 2024 — McMap. All rights reserved.