JFreeChart - horizontal stacked bar chart with date axis
Asked Answered
D

2

2

I have a set of machines and for the management application I need to make a diagram or chart to show the state of each machine. In the database there is a column state where the actual state is stored. This state changes according other parameters and by change the time of the event is also stored, that means the timestamp of the event is the start time for the state.

machine-id | event_time (long) | status (int)  

enter image description here

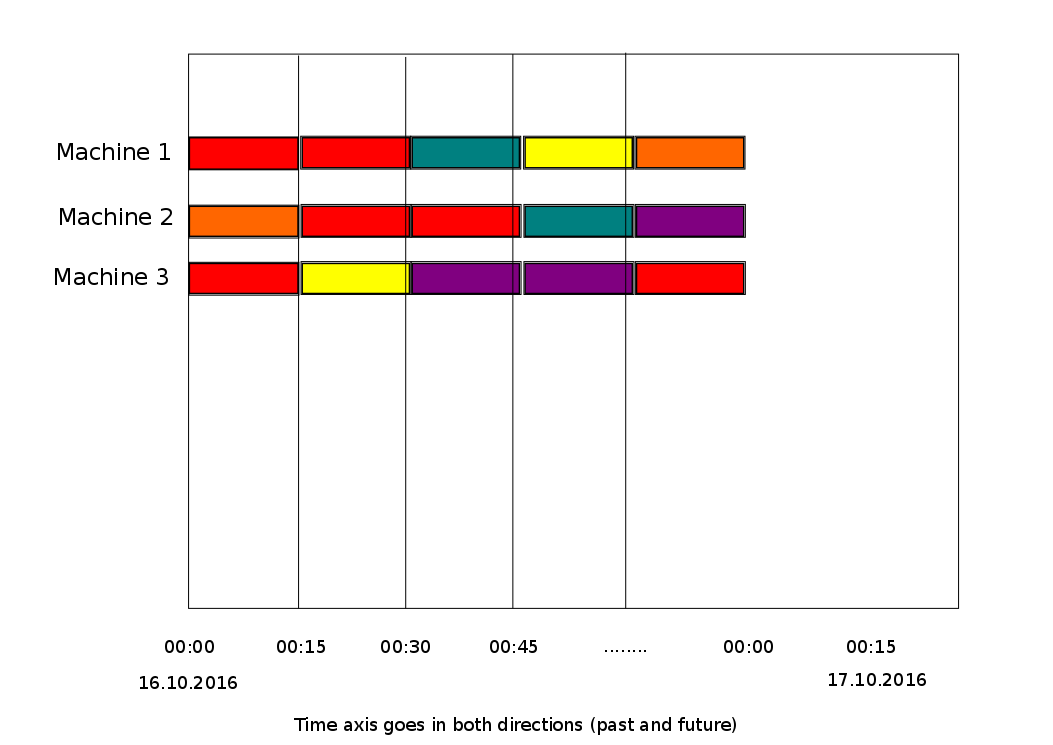
As you can see in the image there are many states on one horizontal line (machine), the colors will be set accourding the value in database.
The time axis goes in both directions, past and future (forecast), with predefined steps (here 1/4 hour) so the user should be able to scroll it somehow.

As a library I am allowed to use JFreeChart, but I've never worked with it before and also I am not such an experienced Java-Developer.

My questions:
- What do I need to do it? (which classes of jfreechart)
- How can I set a first time axis separated in 1/4 hour steps
- How to set a second time axis with the date (formated dd:mm:yyyy) (nice to have)
- How can I make the time axis scrollable (past and future)
- How to set the color for each status

What I really need is a how-to or a tutorial.
The sources and examples I found on the net are almost all a copy of eachother with a very basic usage of the jfreechart lib. So I don't really know how or where to start...

I'll be thankfull for your help.

Downcast answered 18/10, 2016 at 9:55 Comment(0)
D
1

I did with the XYIntervalSeries and XYPlot.
Hier is the example code if someone needs a hint on that:

public class XYIntervalBarChart extends ApplicationFrame{

private static final String NODATA_SERIES   = "NODATA";
private static final String STANDBY_SERIES  = "STANDBY";
private static final String HEATING_SERIES  = "HEATING";
private static final String HOLDING_SERIES  = "HOLDING";
private static final String COOLING_SERIES  = "COOLING";
private static final String LOWERING_SERIES = "LOWERING";

ArrayList<EventStatus> testData = null;
String[] catArray;

JFreeChart chart;
DateAxis dateAxis;

Date chartStartDate;
Date chartEndDate;

public XYIntervalBarChart(String title) {
    super(title);
    // set up some test data
    initData();

    chartStartDate  = new Date(1477461600000L);
    chartEndDate = new Date(1477497600000L);
    chart = createIntervalStackedChart();
    ChartPanel chartPanel = new ChartPanel(chart);
    chartPanel.setPreferredSize(new Dimension(600, 450));
    setContentPane(chartPanel);
}

private JFreeChart createIntervalStackedChart() {
    XYIntervalSeriesCollection dataset = createXYIntervalDataset();
    XYBarRenderer xyRend = new XYBarRenderer();
    xyRend.setShadowVisible(false);
    xyRend.setUseYInterval(true);
    xyRend.setBarPainter(new StandardXYBarPainter());
    xyRend.setSeriesPaint(0, Color.BLACK);
    xyRend.setSeriesPaint(1, Color.DARK_GRAY);
    xyRend.setSeriesPaint(2, Color.RED);
    xyRend.setSeriesPaint(3, Color.YELLOW);
    xyRend.setSeriesPaint(4, Color.CYAN);
    xyRend.setSeriesPaint(5, Color.GREEN);

    dateAxis = new DateAxis();
    dateAxis.setVerticalTickLabels(true);
    dateAxis.setDateFormatOverride(new SimpleDateFormat("dd.MM.yy HH:mm"));
    XYPlot plot = new XYPlot(dataset, new SymbolAxis("", catArray), dateAxis, xyRend);
    plot.setOrientation(PlotOrientation.HORIZONTAL);
    plot.setBackgroundPaint(Color.LIGHT_GRAY);
    return new JFreeChart(plot);
}

private XYIntervalSeriesCollection createXYIntervalDataset() {
    XYIntervalSeriesCollection dataset = new XYIntervalSeriesCollection();

    int statesCount = 6;
    String[] states = new String[] {NODATA_SERIES, STANDBY_SERIES, HEATING_SERIES, HOLDING_SERIES, COOLING_SERIES, LOWERING_SERIES};

    XYIntervalSeries[] series = new XYIntervalSeries[statesCount];
    for (int i = 0; i < statesCount; i++) {
        series[i] = new XYIntervalSeries(states[i]);
        dataset.addSeries(series[i]);
    }

    for (int i = 0; i < testData.size(); i++) {
        EventStatus es = testData.get(i);
        int machNo = es.getPlanningNo();
        int state = es.getStatus();
        long eventStart = es.getTime();
        long eventEnd = 0;
        if (testData.indexOf(es) == testData.size() - 1) {
            eventEnd = chartEndDate.getTime();
        }
        else {
            EventStatus nextEs = testData.get(i + 1);
            if (nextEs.getTime() > eventStart) {
                eventEnd = nextEs.getTime();
            }
            else {
                eventEnd = chartEndDate.getTime();
            }
        }

        long duration = TimeUnit.MILLISECONDS.convert(eventEnd - eventStart, TimeUnit.MILLISECONDS);
        series[state].add(machNo, machNo - 0.2, machNo + 0.2, eventStart, eventStart, eventStart + duration);
    }

    return dataset;
}

private void initData() {
    testData = new ArrayList<EventStatus>();
    testData.add(new EventStatus("Mach-1", 1477468500000L, 1, 0)); // 26.10.16 09:55  standby
    testData.add(new EventStatus("Mach-1", 1477472100000L, 2, 0)); // 26.10.16 10:55  heating
    testData.add(new EventStatus("Mach-1", 1477474200000L, 5, 0)); // 26.10.16 11:30  lowering
    testData.add(new EventStatus("Mach-1", 1477476000000L, 3, 0)); // 26.10.16 12:00  holding
    testData.add(new EventStatus("Mach-1", 1477479600000L, 4, 0)); // 26.10.16 13:00  cooling
    testData.add(new EventStatus("Mach-1", 1477486800000L, 1, 0)); // 26.10.16 15:00  standby

    testData.add(new EventStatus("Mach-2", 1477465200000L, 3, 1)); // 26.10.16 09:00  holding
    testData.add(new EventStatus("Mach-2", 1477472400000L, 2, 1)); // 26.10.16 11:00  heating
    testData.add(new EventStatus("Mach-2", 1477474200000L, 5, 1)); // 26.10.16 11:30  lowering
    testData.add(new EventStatus("Mach-2", 1477476000000L, 2, 1)); // 26.10.16 12:00  heating
    testData.add(new EventStatus("Mach-2", 1477479600000L, 3, 1)); // 26.10.16 13:00  holding
    testData.add(new EventStatus("Mach-2", 1477486800000L, 4, 1)); // 26.10.16 15:00  cooling


    ArrayList<String> list = new ArrayList<>();
    for (EventStatus eventStatus : testData) {
        if (list.contains(eventStatus.getName()))
            continue;
        else
            list.add(eventStatus.getName());
    }

    catArray = new String[list.size()];
    catArray = list.toArray(catArray);
}

public static void main(String[] args) {
    XYIntervalBarChart demo = new XYIntervalBarChart("XYIntervalBarChart");
    demo.pack();
    RefineryUtilities.centerFrameOnScreen(demo);
    demo.setVisible(true);

}}

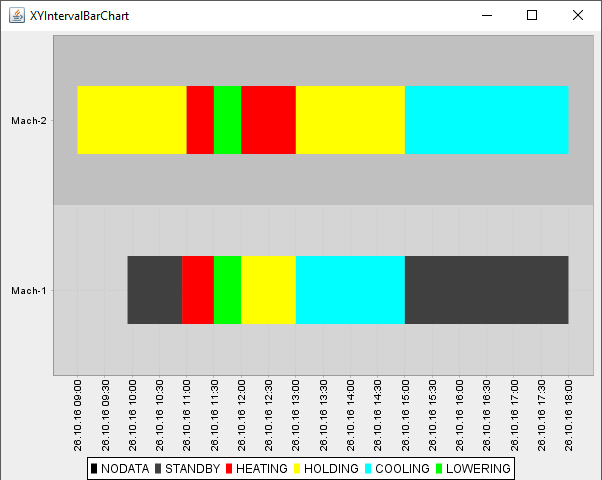
Result:
enter image description here

Downcast answered 28/10, 2016 at 12:29 Comment(2)
Hi sir. I am trying to interpret some data to a bar chart like this one but I need more clarfification. can you help me please?Owensby
@Downcast I tried your code But Bar Chart was rendered incorrectly . Do you have any update or editing to do it ?Therewithal
S
2

You're going to have to combine some examples:

  • Use a CategoryDataset like DefaultCategoryDataset for your data. Use ChartFactory.createStackedBarChart() with PlotOrientation.HORIZONTAL to create the chart.

  • Make sure the first parameter to addValue() is a multiple of 15 minutes, in milliseconds.

  • Use a DateAxis for the domain; call setDateFormatOverride() to get the format you want.

    DateAxis dateAxis = new DateAxis("Time");
    dateAxis.setDateFormatOverride(new SimpleDateFormat("HH:mm"));
    categoryplot.setRangeAxis(dateAxis);
    
  • For scrolling, use a SlidingCategoryDataset like they suggest here, or use the zoom commands from the context menu.

  • For color, use a custom getItemPaint(), like they show here.

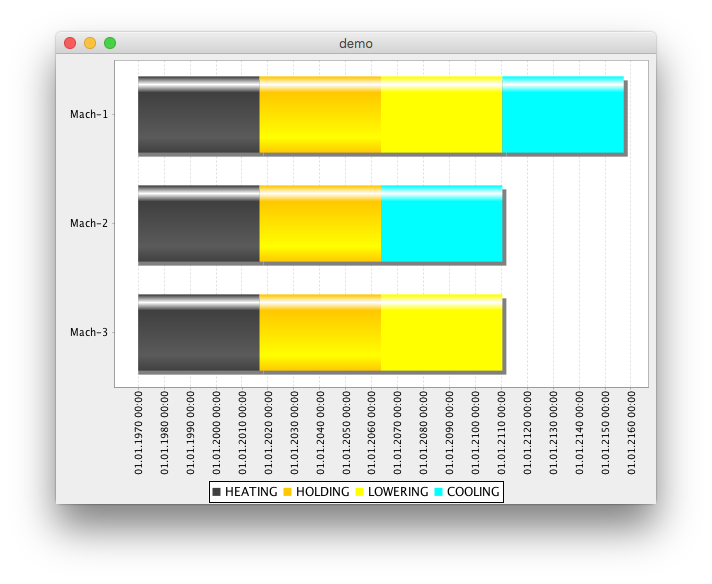
I did set the DateFormat to show years, and it has 1970 as a year! Why?

You're example is creating new date values using seconds, but Date expects milliseconds. I added 000L to the time values, moved the range calculation to createDataset(), and let the axis auto-range.

chart

import java.awt.Color;
import java.awt.Dimension;
import java.text.SimpleDateFormat;
import java.util.ArrayList;
import java.util.Date;
import org.jfree.chart.ChartPanel;
import org.jfree.chart.JFreeChart;
import org.jfree.chart.axis.AxisLocation;
import org.jfree.chart.axis.CategoryAxis;
import org.jfree.chart.axis.DateAxis;
import org.jfree.chart.axis.DateTickUnit;
import org.jfree.chart.axis.DateTickUnitType;
import org.jfree.chart.plot.CategoryPlot;
import org.jfree.chart.plot.PlotOrientation;
import org.jfree.chart.renderer.category.StackedBarRenderer;
import org.jfree.data.Range;
import org.jfree.data.category.CategoryDataset;
import org.jfree.data.category.DefaultCategoryDataset;
import org.jfree.ui.ApplicationFrame;
import org.jfree.ui.RefineryUtilities;

public class StackedTimeBarChart extends ApplicationFrame {

    private static final String STANDBY_SERIES = "STANDBY";
    private static final String HEATING_SERIES = "HEATING";
    private static final String HOLDING_SERIES = "HOLDING";
    private static final String COOLING_SERIES = "COOLING";
    private static final String LOWERING_SERIES = "LOWERING";
    private static final int STANDBY_SERIES_INDEX = 0;
    private static final int HEATING_SERIES_INDEX = 1;
    private static final int HOLDING_SERIES_INDEX = 2;
    private static final int COOLING_SERIES_INDEX = 3;
    private static final int LOWERING_SERIES_INDEX = 4;
    private static final Color STANDBY_COLOR = Color.DARK_GRAY;
    private static final Color HEATING_COLOR = Color.ORANGE;
    private static final Color HOLDING_COLOR = Color.YELLOW;
    private static final Color COOLING_COLOR = Color.CYAN;
    private static final Color LOWERING_COLOR = Color.GREEN;

    ArrayList<EventStatus> testData = null;
    CategoryPlot plot;

    public StackedTimeBarChart(String title) {
        super(title);
        // set up some test data
        initData();

        // set the start and end date of the chart
        plot = new CategoryPlot();
        plot.setRangeAxisLocation(AxisLocation.BOTTOM_OR_RIGHT);
        plot.setOrientation(PlotOrientation.HORIZONTAL);

        // create dataset
        CategoryDataset dataset = createDataset();

        // create the axis
        CategoryAxis catAxis = new CategoryAxis();
        DateAxis dateAxis = new DateAxis();
        dateAxis.setVerticalTickLabels(true);
        //dateAxis.setTickUnit(new DateTickUnit(DateTickUnitType.HOUR, 1));
        dateAxis.setDateFormatOverride(new SimpleDateFormat("dd.MM.yyyy HH:mm"));

        // set up the renderer
        StackedBarRenderer rend = new StackedBarRenderer();
        //rend.setBase(chartRange.getLowerBound());
        rend.setSeriesPaint(STANDBY_SERIES_INDEX, STANDBY_COLOR);
        rend.setSeriesPaint(HEATING_SERIES_INDEX, HEATING_COLOR);
        rend.setSeriesPaint(HOLDING_SERIES_INDEX, HOLDING_COLOR);
        rend.setSeriesPaint(COOLING_SERIES_INDEX, COOLING_COLOR);
        rend.setSeriesPaint(LOWERING_SERIES_INDEX, LOWERING_COLOR);

        // set up the plot
        plot.setDataset(dataset);
        plot.setDomainAxis(catAxis);
        plot.setRangeAxis(dateAxis);
        plot.setRenderer(rend);

        // create the chart and add it
        JFreeChart chart = new JFreeChart("", JFreeChart.DEFAULT_TITLE_FONT, plot, true);
        ChartPanel chartPanel = new ChartPanel(chart);
        chartPanel.setPreferredSize(new Dimension(600, 450));
        setContentPane(chartPanel);
    }

    private CategoryDataset createDataset() {
        DefaultCategoryDataset dataset = new DefaultCategoryDataset();
        Date chartStartDate = new Date(testData.get(0).getTime());
        Date chartEndDate = new Date(testData.get(testData.size() - 1).getTime());
        Range chartRange = new Range(chartStartDate.getTime(), chartEndDate.getTime());
        if (testData != null) {
            for (int i = 0; i < testData.size(); i++) {
                // is there data?
                if (testData.size() > 0) {
                    for (int j = 0; j < testData.size(); j++) {
                        EventStatus es = testData.get(j);
                        long eventTime = es.getTime();
                        int status = es.getStatus();
                        String name = es.getName();

                        // if data event time is in the range of the chart then show it
                        // THIS DOES NOT WORK PROPERLY!!!!
                        if (eventTime >= chartStartDate.getTime() && eventTime < chartEndDate.getTime()) {
                            // create series and categories
                            if (es.getStatus() == STANDBY_SERIES_INDEX) {
                                dataset.addValue(new Double(es.getTime()), STANDBY_SERIES, es.getName());
                            } else if (es.getStatus() == HEATING_SERIES_INDEX) {
                                dataset.addValue(new Double(es.getTime()), HEATING_SERIES, es.getName());
                            } else if (es.getStatus() == HOLDING_SERIES_INDEX) {
                                dataset.addValue(new Double(es.getTime()), HOLDING_SERIES, es.getName());
                            } else if (es.getStatus() == COOLING_SERIES_INDEX) {
                                dataset.addValue(new Double(es.getTime()), COOLING_SERIES, es.getName());
                            } else if (es.getStatus() == LOWERING_SERIES_INDEX) {
                                dataset.addValue(new Double(es.getTime()), LOWERING_SERIES, es.getName());
                            } else {
                                dataset.addValue(chartRange.getUpperBound() - chartRange.getLowerBound(), STANDBY_SERIES, es.getName());
                            }
                        } else {
                            continue;
                        }
                    }
                }
            }
        } else {
            plot.setNoDataMessage("NO DATA AVAILABLE");
        }

        return dataset;
    }

    public static void main(String[] args) {
        StackedTimeBarChart demo = new StackedTimeBarChart("demo");
        demo.pack();
        RefineryUtilities.centerFrameOnScreen(demo);
        demo.setVisible(true);

    }

    private void initData() {
        testData = new ArrayList<EventStatus>();
        testData.add(new EventStatus("Mach-1", 1476950160000L, 1));
        testData.add(new EventStatus("Mach-1", 1476952200000L, 2));
        testData.add(new EventStatus("Mach-1", 1476964800000L, 4));
        testData.add(new EventStatus("Mach-1", 1476966600000L, 3));
        testData.add(new EventStatus("Mach-2", 1476943200000L, 1));
        testData.add(new EventStatus("Mach-2", 1476946800000L, 4));
        testData.add(new EventStatus("Mach-2", 1476954000000L, 2));
        testData.add(new EventStatus("Mach-2", 1476955800000L, 1));
        testData.add(new EventStatus("Mach-2", 1476973800000L, 3));
        testData.add(new EventStatus("Mach-3", 1476959400000L, 2));
        testData.add(new EventStatus("Mach-3", 1476966600000L, 1));
        testData.add(new EventStatus("Mach-3", 1476970200000L, 4));
        testData.add(new EventStatus("Mach-3", 1476972000000L, 1));
        testData.add(new EventStatus("Mach-3", 1476986400000L, 2));
    }

// Chart object class that hold category, event time and status
    private class EventStatus {

        private String name;
        private long time;
        private int status;

        public EventStatus(String name, long time, int status) {
            this.name = name;
            this.time = time;
            this.status = status;
        }

        public String getName() {
            return name;
        }

        public void setName(String name) {
            this.name = name;
        }

        public long getTime() {
            return time;
        }

        public void setTime(long time) {
            this.time = time;
        }

        public int getStatus() {
            return status;
        }

        public void setStatus(int status) {
            this.status = status;
        }
    }
}
Sora answered 18/10, 2016 at 11:26 Comment(10)
See also this related example.Quoits
thanks for the hints and example links, I will give the examples a try and see how it worksDowncast
Hi guys, I am trying your suggestion but i can not figure out why the bars are not set correctly to the date axis?!? I did store some test data in th db with start time and status. the time is by the way a while ago (yesterdy) but it still show me bars in the chart which is wrong!!!Downcast
I did edit the question with what i have actually, so maybe you can give me a hint on what is wrong?Downcast
I'm not seeing it; can you post a self-contained minimal reproducible example with just a few categories?Sora
Hi Catalina, I did update the question with a smcv example with test data.. Did not chage the images because its same behaviour. I did set the DateFormat to show years and it hast 1970 as a year!!! why?? I do set the range of the chart!!Downcast
@Catalina Island Thanks Catalina, this did bring me on what it could be wrong.. Now I need to know if it is possible to set the series paint manually? the dynamic creation of the series dependent on data available changes the colors assigned to the series, this is bad.. I need to have fix colors for series that dont change?!?Downcast
Another thind: I have a datepicker implemented to set the start time of the chart by the user. How can I update the chart correctly? I mean where or how to adjust the range of the date axis so the times are set correctly? appreciate your helpDowncast
Let's keep this question on dates. Matching paints to categories and dynamic updates are whole new design questions.Sora
@CatalinaIsland: Ok, maybe i start new questions about painting and updating... So how do i have to set the event times correctly? Means, how to sync the date axis and starting event times so the status starts always at the same date. Because right now the startpoint varies if i change the start time of the chart.. I have set the DateTickUnit to minute and multiple to 15: new DateTickUnit(DateTickUnitType.MINUTE, 15)Downcast
D
1

I did with the XYIntervalSeries and XYPlot.
Hier is the example code if someone needs a hint on that:

public class XYIntervalBarChart extends ApplicationFrame{

private static final String NODATA_SERIES   = "NODATA";
private static final String STANDBY_SERIES  = "STANDBY";
private static final String HEATING_SERIES  = "HEATING";
private static final String HOLDING_SERIES  = "HOLDING";
private static final String COOLING_SERIES  = "COOLING";
private static final String LOWERING_SERIES = "LOWERING";

ArrayList<EventStatus> testData = null;
String[] catArray;

JFreeChart chart;
DateAxis dateAxis;

Date chartStartDate;
Date chartEndDate;

public XYIntervalBarChart(String title) {
    super(title);
    // set up some test data
    initData();

    chartStartDate  = new Date(1477461600000L);
    chartEndDate = new Date(1477497600000L);
    chart = createIntervalStackedChart();
    ChartPanel chartPanel = new ChartPanel(chart);
    chartPanel.setPreferredSize(new Dimension(600, 450));
    setContentPane(chartPanel);
}

private JFreeChart createIntervalStackedChart() {
    XYIntervalSeriesCollection dataset = createXYIntervalDataset();
    XYBarRenderer xyRend = new XYBarRenderer();
    xyRend.setShadowVisible(false);
    xyRend.setUseYInterval(true);
    xyRend.setBarPainter(new StandardXYBarPainter());
    xyRend.setSeriesPaint(0, Color.BLACK);
    xyRend.setSeriesPaint(1, Color.DARK_GRAY);
    xyRend.setSeriesPaint(2, Color.RED);
    xyRend.setSeriesPaint(3, Color.YELLOW);
    xyRend.setSeriesPaint(4, Color.CYAN);
    xyRend.setSeriesPaint(5, Color.GREEN);

    dateAxis = new DateAxis();
    dateAxis.setVerticalTickLabels(true);
    dateAxis.setDateFormatOverride(new SimpleDateFormat("dd.MM.yy HH:mm"));
    XYPlot plot = new XYPlot(dataset, new SymbolAxis("", catArray), dateAxis, xyRend);
    plot.setOrientation(PlotOrientation.HORIZONTAL);
    plot.setBackgroundPaint(Color.LIGHT_GRAY);
    return new JFreeChart(plot);
}

private XYIntervalSeriesCollection createXYIntervalDataset() {
    XYIntervalSeriesCollection dataset = new XYIntervalSeriesCollection();

    int statesCount = 6;
    String[] states = new String[] {NODATA_SERIES, STANDBY_SERIES, HEATING_SERIES, HOLDING_SERIES, COOLING_SERIES, LOWERING_SERIES};

    XYIntervalSeries[] series = new XYIntervalSeries[statesCount];
    for (int i = 0; i < statesCount; i++) {
        series[i] = new XYIntervalSeries(states[i]);
        dataset.addSeries(series[i]);
    }

    for (int i = 0; i < testData.size(); i++) {
        EventStatus es = testData.get(i);
        int machNo = es.getPlanningNo();
        int state = es.getStatus();
        long eventStart = es.getTime();
        long eventEnd = 0;
        if (testData.indexOf(es) == testData.size() - 1) {
            eventEnd = chartEndDate.getTime();
        }
        else {
            EventStatus nextEs = testData.get(i + 1);
            if (nextEs.getTime() > eventStart) {
                eventEnd = nextEs.getTime();
            }
            else {
                eventEnd = chartEndDate.getTime();
            }
        }

        long duration = TimeUnit.MILLISECONDS.convert(eventEnd - eventStart, TimeUnit.MILLISECONDS);
        series[state].add(machNo, machNo - 0.2, machNo + 0.2, eventStart, eventStart, eventStart + duration);
    }

    return dataset;
}

private void initData() {
    testData = new ArrayList<EventStatus>();
    testData.add(new EventStatus("Mach-1", 1477468500000L, 1, 0)); // 26.10.16 09:55  standby
    testData.add(new EventStatus("Mach-1", 1477472100000L, 2, 0)); // 26.10.16 10:55  heating
    testData.add(new EventStatus("Mach-1", 1477474200000L, 5, 0)); // 26.10.16 11:30  lowering
    testData.add(new EventStatus("Mach-1", 1477476000000L, 3, 0)); // 26.10.16 12:00  holding
    testData.add(new EventStatus("Mach-1", 1477479600000L, 4, 0)); // 26.10.16 13:00  cooling
    testData.add(new EventStatus("Mach-1", 1477486800000L, 1, 0)); // 26.10.16 15:00  standby

    testData.add(new EventStatus("Mach-2", 1477465200000L, 3, 1)); // 26.10.16 09:00  holding
    testData.add(new EventStatus("Mach-2", 1477472400000L, 2, 1)); // 26.10.16 11:00  heating
    testData.add(new EventStatus("Mach-2", 1477474200000L, 5, 1)); // 26.10.16 11:30  lowering
    testData.add(new EventStatus("Mach-2", 1477476000000L, 2, 1)); // 26.10.16 12:00  heating
    testData.add(new EventStatus("Mach-2", 1477479600000L, 3, 1)); // 26.10.16 13:00  holding
    testData.add(new EventStatus("Mach-2", 1477486800000L, 4, 1)); // 26.10.16 15:00  cooling


    ArrayList<String> list = new ArrayList<>();
    for (EventStatus eventStatus : testData) {
        if (list.contains(eventStatus.getName()))
            continue;
        else
            list.add(eventStatus.getName());
    }

    catArray = new String[list.size()];
    catArray = list.toArray(catArray);
}

public static void main(String[] args) {
    XYIntervalBarChart demo = new XYIntervalBarChart("XYIntervalBarChart");
    demo.pack();
    RefineryUtilities.centerFrameOnScreen(demo);
    demo.setVisible(true);

}}

Result:
enter image description here

Downcast answered 28/10, 2016 at 12:29 Comment(2)
Hi sir. I am trying to interpret some data to a bar chart like this one but I need more clarfification. can you help me please?Owensby
@Downcast I tried your code But Bar Chart was rendered incorrectly . Do you have any update or editing to do it ?Therewithal

© 2022 - 2024 — McMap. All rights reserved.