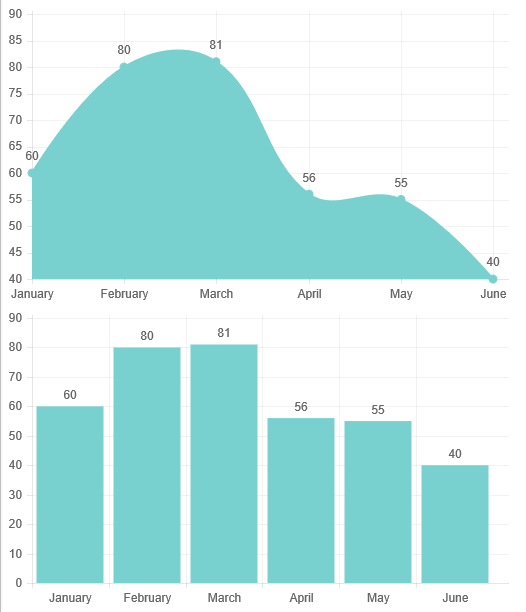
How to show data values or index labels in ChartJs (Latest Version) as in the below image:
I am using the ChartJs to display charts in my React Project. Everything is working fine, except this.
I found an answer in stackoverflow (https://stackoverflow.com/a/31632707), But it uses an old version of chartjs and is not working on the one which I am using.
My ChartJs Code:
var ctx = document.getElementById("myChart");

var BarChart = new Chart(ctx, {
    type: 'bar',
    data: {
        labels: ["Jan","Feb","March"],
        datasets: [{
            label: "Chart Data",
            data: [10,20,15],
            backgroundColor: "red",
            borderColor: "green",
            borderWidth: 1
        }]
    },
    options: {
        legend: {
            display: false
        },
        scales: {
            yAxes: [{
                ticks: {
                    beginAtZero: true
                }
            }],
            xAxes: [{
                ticks: {
                    maxRotation: 180
                }
            }]
        }
    }
});
I tried adding it using the function: ctx.fillText(bar.value, bar.x, bar.y - 5);, But its showing .fillText is not a function


ctxdefined when you call this?.fillText()is acanvasfunction and should be there. Maybe it is just your declaration. I think it should bevar ctx = document.getElementById("myChart").getContext("2d");– Antitrustthis.datasetsas undefined. But console.log(this) =>{chart: t, config: Object, options: Object, id: 0, titleBlock: n…}But this object does not contain the datasets object – Literaturechart.config.data– Antitrustchart.config.datadoes not contain thebarsarray. Also it does not contain the x and y values – Literature