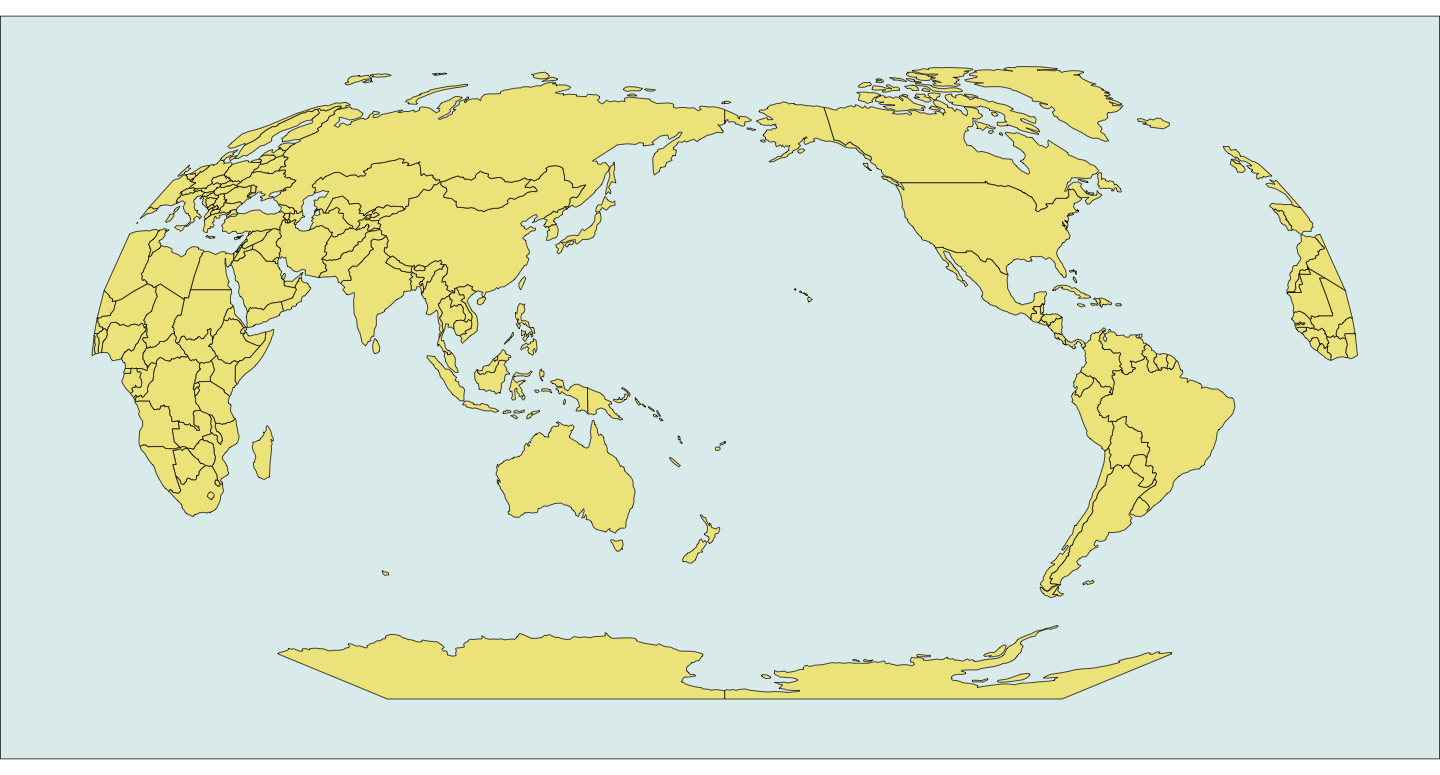
You'll need GDAL / rgdal for this and it's 180 vs 150 but you should be able to extrapolate. GIS SO FTW!
library(ggplot2)
library(ggthemes)
library(sp)
library(rgdal)

# assumes you are in the ne_110m... directory
# split the world and stitch it back together again

system("ogr2ogr world_part1.shp ne_110m_admin_0_countries.shp -clipsrc -180 -90 0 90")
system("ogr2ogr world_part2.shp ne_110m_admin_0_countries.shp -clipsrc 0 -90 180 90")
system('ogr2ogr world_part1_shifted.shp world_part1.shp -dialect sqlite -sql "SELECT ShiftCoords(geometry,360,0), admin FROM world_part1"')
system("ogr2ogr world_0_360_raw.shp world_part2.shp")
system("ogr2ogr -update -append world_0_360_raw.shp world_part1_shifted.shp -nln world_0_360_raw")

world <- readOGR("ne_110m_admin_0_countries/world_0_360_raw.shp", "world_0_360_raw")
world_robin <- spTransform(world, CRS("+proj=robin +lon_0=180 +x_0=0 +y_0=0 +ellps=WGS84 +datum=WGS84 +units=m +no_defs"))

world_dat <- fortify(world_robin)

gg <- ggplot()
gg <- gg + geom_map(data=world_dat, map=world_dat,
                    aes(x=long, y=lat, map_id=id),
                    fill="khaki", color="black", size=0.25)
gg <- gg + coord_equal()
gg <- gg + theme_map()
gg <- gg + theme(plot.background=element_rect(fill="azure2"))
gg
![enter image description here]()
You can use gdalUtils for this as well, but it just calls the system binaries and you have to specify the clipping polygons with well known strings (so the system call is a few characters shorter for the line).
FYI: Doing this means you have to shift and project all points/shapes before plotting with ggplot2.


sf– Mensal