Jenkins Build / Pipeline job - Job's listing in tree / layout ordered listing
Asked Answered
T

2

0

Is it possible that for a given Build Pipeline job (which has downstream jobs either in the build or post build action as "Trigger build on other projects"), I can get a Tree listing view showing which Pipeline job# N called, what child jobs in the calling order (sequential or parallel) with child build# for that pipeline run build#.

For ex: If my pipeline job has this view: enter image description here then,
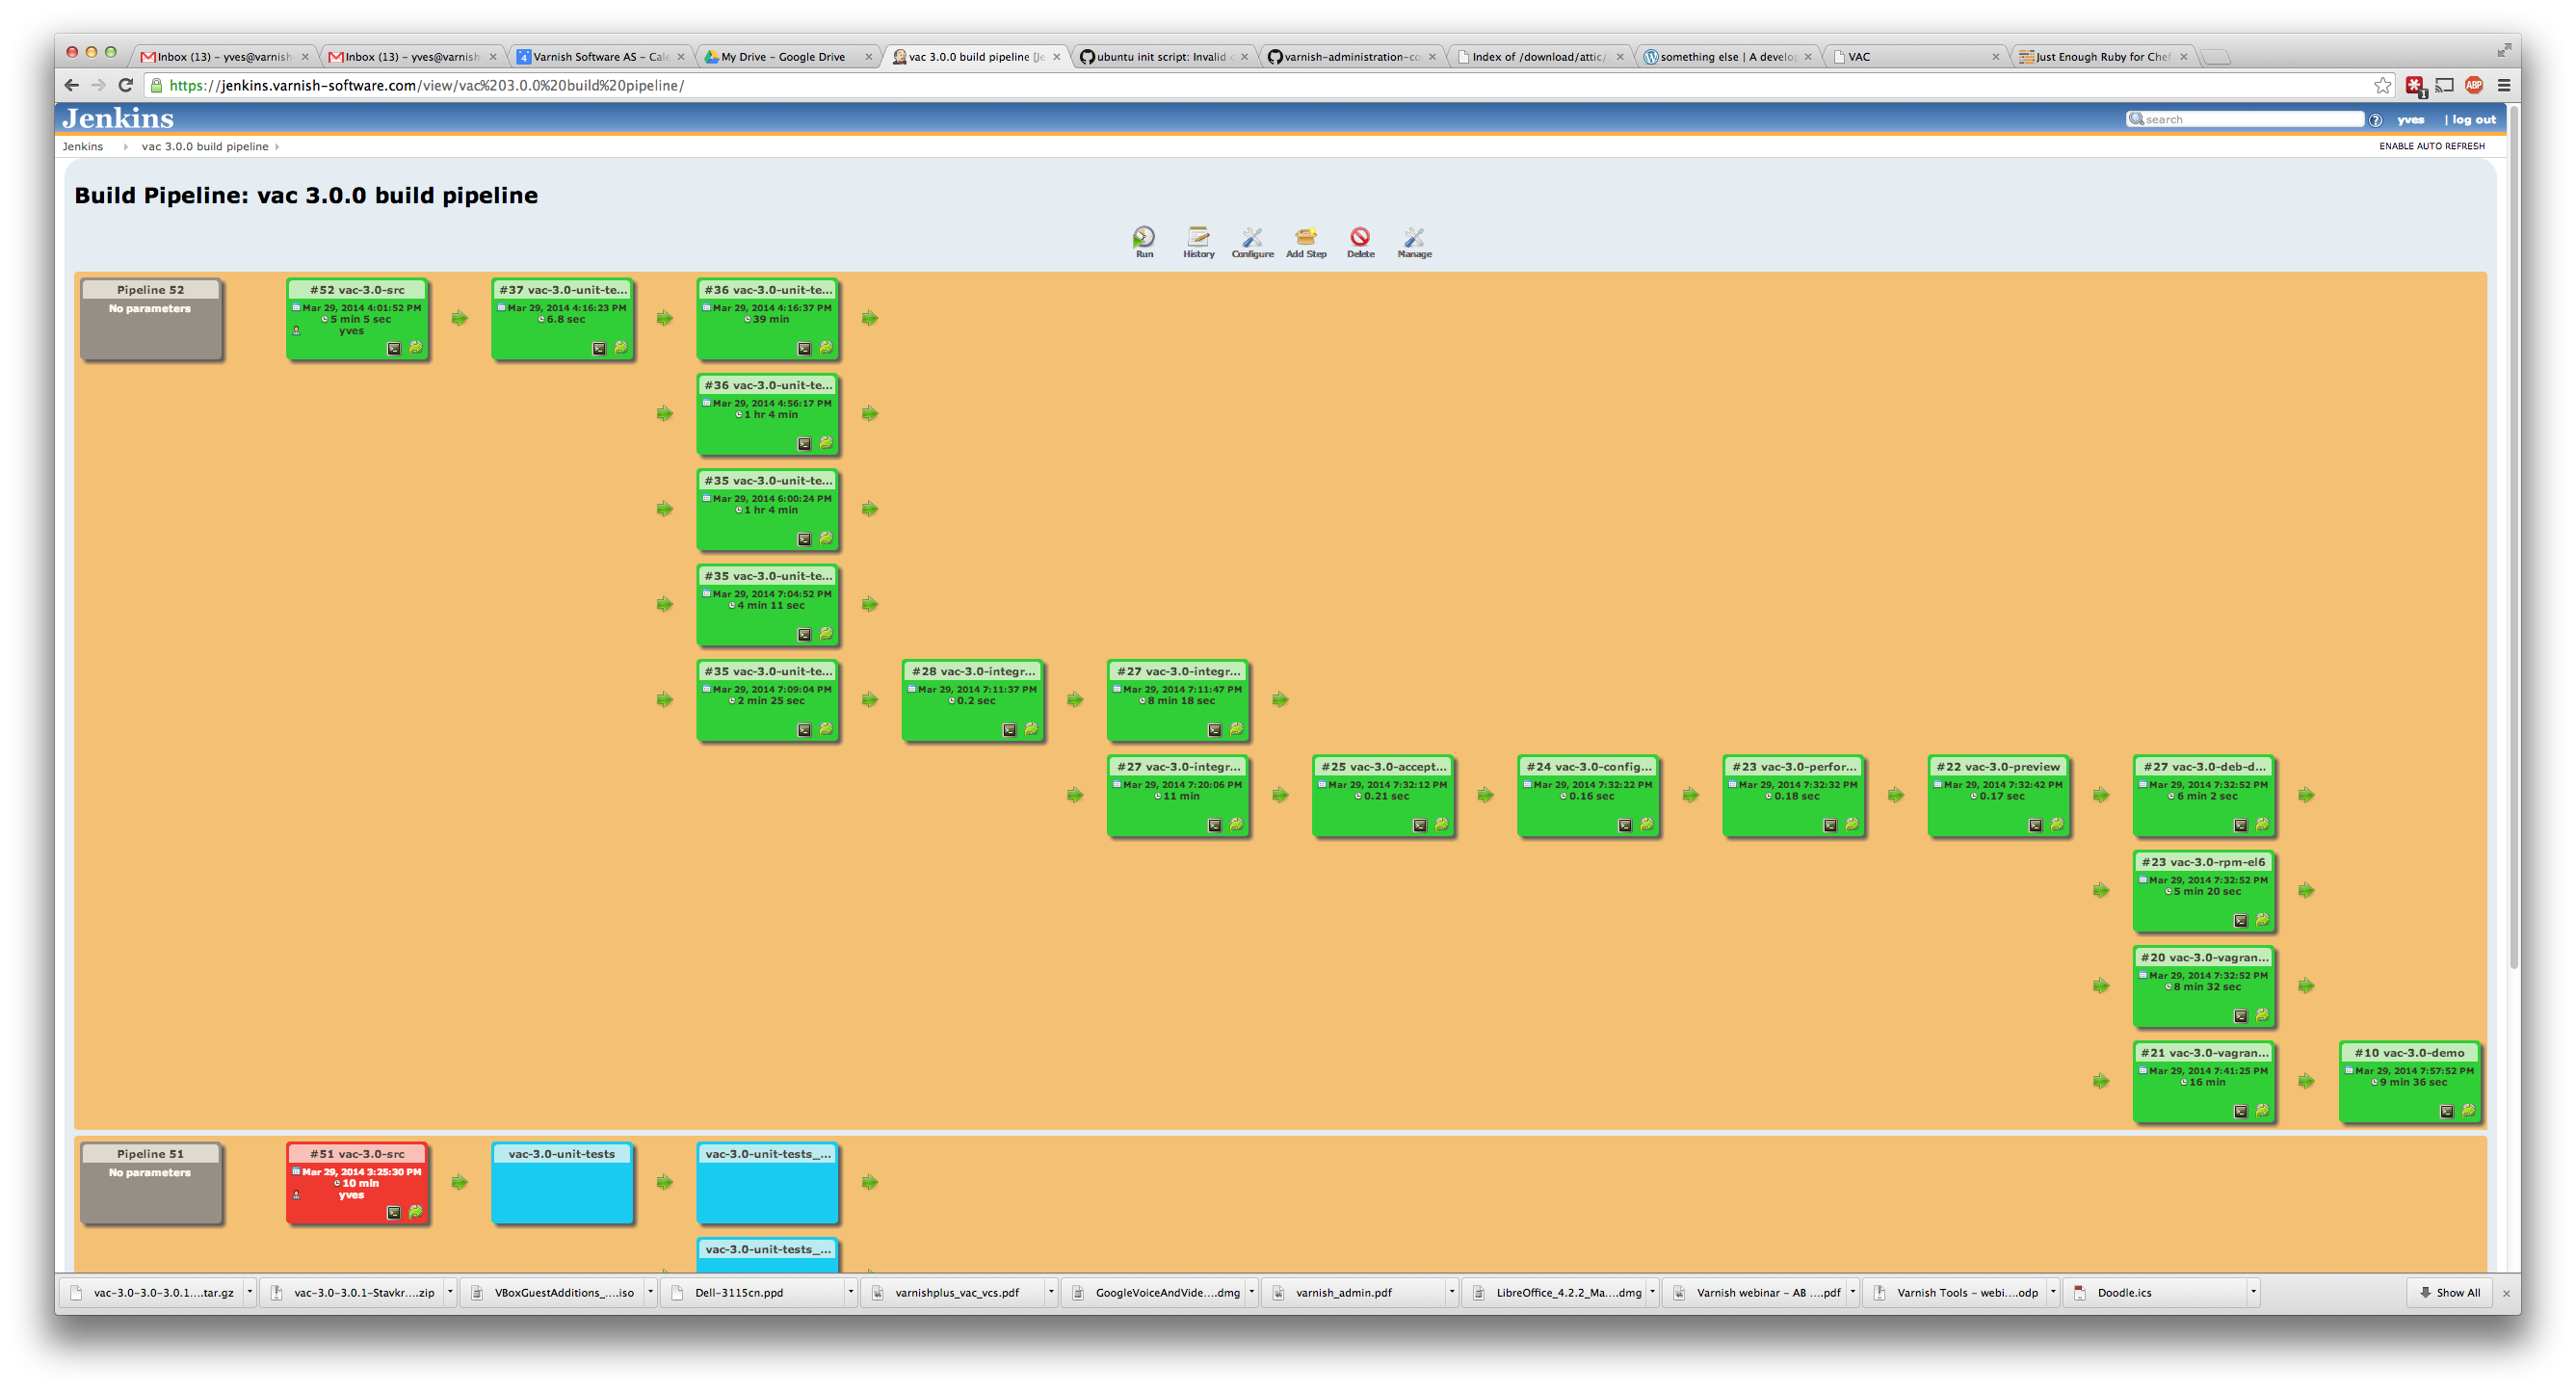
I'm expecting to get a listing of the top run similar to (in case I just put in simple text format):

vac-3.0-src:52 called: vac-3.0-unit-test-main:37
vac-3.0-unit-test-main:37 called: vac-3.0-unit-testA:36
vac-3.0-unit-test-main:37 called: vac-3.0-unit-testB:36
vac-3.0-unit-test-main:37 called: vac-3.0-unit-testC:35
vac-3.0-unit-test-main:37 called: vac-3.0-unit-testD:35
vac-3.0-unit-test-main:37 called: vac-3.0-unit-testReporting:35
vac-3.0-unit-testReporting:35 called: vac-3.0-integration-test-main:28
vac-3.0-integration-test-main:28 called: vac-3.0-integration-testA:27
vac-3.0-integration-test-main:28 called: vac-3.0-integration-testB:27
vac-3.0-integration-testB:27 called: vac-3.0-acceptance-test:25
vac-3.0-acceptance-test:25 called: vac-3.0-configure-something:24 
vac-3.0-configure-something:24 called: vac-3.0-perform-someaction:23
vac-3.0-perform-someaction:23 called: vac-3.0-preview-step:22
vac-3.0-preview-step:22 called: vac-3.0-deb-delivery-job:27
vac-3.0-preview-step:22 called: vac-3.0-rpm-el6:23
vac-3.0-preview-step:22 called: vac-3.0-vagrant-provision:20
vac-3.0-preview-step:22 called: vac-3.0-vagrant-run:21
vac-3.0-vagrant-run:21 called: vac-3.0-demo:10

OR this information can be presented in a more robust structural manner i.e. it can be JSON blob where a parent job has structure which will have all jobs that it called (parallel/sequence) in the pipeline run / given order.

I tried the main job's URL (via curl) with Jenkins API i.e. /api/xml or /api/json?pretty=true&depth=10 or more but it doesn't give me the information that I'm looking for (related to a given pipeline run).

This information is visually available on the pipeline view (as per the image) and some information about subprojects is available on a given Jenkins job's dashboard (which was part of the pipeline) but the order is not there.

I'll appreciate if you have tried to solve this and have any solution to get this data. The reason for this effort is to find metrics horizontally for a given pipeline run (Rather than vertically for each individual job which are part of pipeline as I already have the vertical / individual job metrics for Total time, build#, result etc) but how I can relate each individual job's metrics for a given pipeline run, is what I'm trying to get.

If the above image example is big enough, we can refer a smaller run image snapshot here:

enter image description here

Theory answered 28/4, 2018 at 0:13 Comment(0)
T
1

I see one possible solution, not sure if that's helpful but surely it's an attempt.

Algorithm Steps:
==============
1) Maintain a Direct Parent-Child file (i.e. JobA:JobB, JobA:JobC, JobA:JobC, JobC:JobD, ....) i.e. this file will tell that for each JobX, what's are the direct Sub-child/downstream jobs of that. Via Jenkins Groovy script, this can be easily generated/available. PS: You can add more columns to this file i.e. JobA:JobB:Build:Sequential or JobA:JobB:Test:Parallel to get even better horizontal metrics for calculating turnaround time / per given step (build, test, deploy, etc) and whether a parent job called the child job in a sequence or in parallel with two or more jobs) and calculate the metrics accordingly.

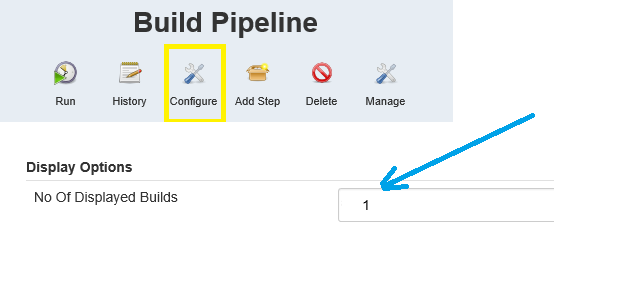
2) Inside "Build Pipeline View" Configure (Settings), set the no. of jobs to be displayed as 1.
PS: You can set this to whatever 5, 10, or more if you want to capture a given pipeline build# of that main pipeline job.

For testing purpose, I'm showing only 1 pipeline build run. enter image description here

3) In Linux, use curl, get the "View Source" HTML page information on the build-pipeline-view's NAME (PS: This is NOT on the main pipeline job). i.e. **not for jobA or xxvt-main or ** in this case, but use the View Name URL (which shows the whole pipeline). Let's assume the view name (via Build Pipeline View plugin) was created as "MyPipelineView" ex: curl -s http://my-jenkins-server:8080/view/MyPipelineView/ > /tmp/9.txt

This will give you the HTML content. Store this information in some file (Temporary). Let's assume I stored it in /tmp/9.txt

3) Run the following command to get the job's build#s. As per the second smaller pipeline image (in my post), the output of that will be:

grep -o "\"extId\":\"[a-zA-Z0-9_-][a-zA-Z0-9_-]*#[0-9][0-9]*\"" /tmp/9.txt

This will give you output like (use sed/cut to make it more cleaner):

"extId":"xxvt_main#157"
"extId":"xxvt_splunk_run_collect_operation#29"
"extId":"xxvt_splunk_run_process_operation#29"
"extId":"xxvt_splunk_update_date_restart_splunk#29"
"extId":"xxvt_splunk_get_jenkins_data#38"
"extId":"xxvt_splunk_get_clearquest_dr_data#47"

4) Now you have the above output for a given pipeline run, using the Parent-Child (direct relationship) file (which we generated in bullet 1), we can use that to create our final Build Pipeline Tree file i.e.

xxvt_main#157 called: xxvt_splunk_get_jenkins_data#38
xxvt_main#157 called: xxvt_splunk_get_clearquest_dr_data#47
xxvt_main#157 called: xxvt_splunk_run_collect_operation#29
xxvt_splunk_run_collect_operation#29 called: xxvt_splunk_run_process_operation#29
xxvt_splunk_run_process_operation#29 called: xxvt_splunk_update_date_restart_splunk#29

5) Upon knowing the a given run related job-name and its build#, we can use Jenkins's api/json?pretty=true&depth=1 or 2 or 3 carefully, to fetch fields we want to fetch for metrics and finally create/come up with a .csv file in whatever format you like, which will have metrics for a given pipeline run - HORIZONTALLY.

Theory answered 28/4, 2018 at 1:2 Comment(0)
T
0

If you are working with Jenkinsfile DSL etc.. I achieved it via dynamically creating the stages, running them in parallel and also getting Jenkinsfile UI to show separate columns. This assumes parallel steps are independent of each other (otherwise don't use parallel) and you can nest them as deep as you want (depending upon the for loop).

Jenkinsfile Pipeline DSL: How to Show Multi-Columns in Jobs dashboard GUI - For all Dynamically created stages - When within PIPELINE section see here for more.

Theory answered 23/12, 2019 at 18:24 Comment(0)

© 2022 - 2024 — McMap. All rights reserved.