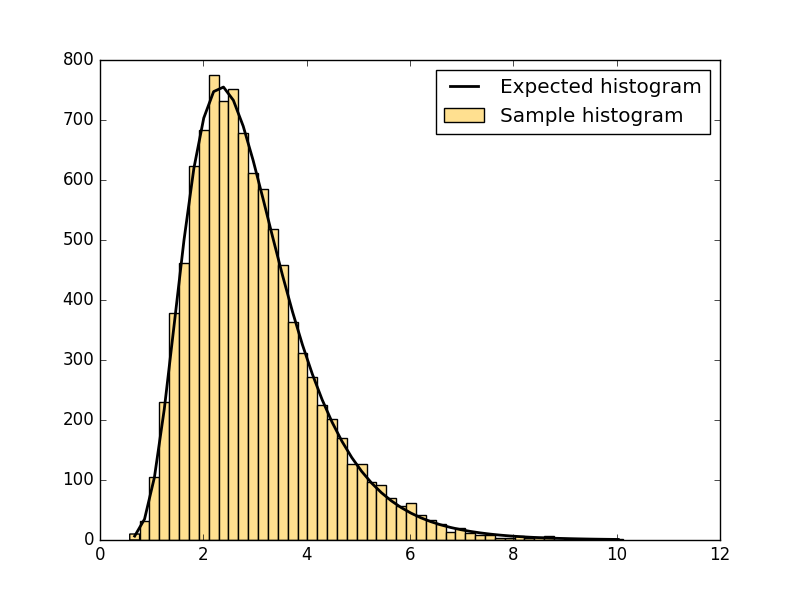
What you are asking for is a plot of the expected histogram.
Suppose [a, b] is one of the x intervals of the histogram. For a random
sample of size n, the expected number of samples in the interval is
(cdf(b) - cdf(a))*n
where cdf(x) is the cumulative distribution function. To plot the expected histogram, you'll compute that value for each bin.
The script below shows one way to plot the expected histogram
on top of a matplotlib histogram. It generates this plot:
![histogram plot]()
import numpy as np
import scipy.stats
import matplotlib.pyplot as plt


# Generate log-normal distributed set of samples
np.random.seed(1234)
samples = np.random.lognormal(mean=1., sigma=.4, size=10000)

# Make a fit to the samples.
shape, loc, scale = scipy.stats.lognorm.fit(samples, floc=0)

# Create the histogram plot using matplotlib.  The first two values in
# the tuple returned by hist are the number of samples in each bin and
# the values of the histogram's bin edges.  counts has length num_bins,
# and edges has length num_bins + 1.
num_bins = 50
clr = '#FFE090'
counts, edges, patches = plt.hist(samples, bins=num_bins, color=clr, ec='k', label='Sample histogram')

# Create an array of length num_bins containing the center of each bin.
centers = 0.5*(edges[:-1] + edges[1:])

# Compute the CDF at the edges. Then prob, the array of differences,
# is the probability of a sample being in the corresponding bin.
cdf = scipy.stats.lognorm.cdf(edges, shape, loc=loc, scale=scale)
prob = np.diff(cdf)

plt.plot(centers, samples.size*prob, 'k-', linewidth=2, label='Expected histogram')

# prob can also be approximated using the PDF at the centers multiplied
# by the width of the bin:
# p = scipy.stats.lognorm.pdf(centers, shape, loc=loc, scale=scale)
# prob = p*(edges[1] - edges[0])
# plt.plot(centers, samples.size*prob, 'r')

plt.legend()

plt.show()
Note: Since the PDF is the derivative of the CDF, you can write an approximation of cdf(b) - cdf(a) as
cdf(b) - cdf(a) = pdf(m)*(b - a)
where m is, say, the midpoint of the interval [a, b]. Then the answer to the exact question that you asked is to scale the PDF by multiplying it by the sample size and the histogram bin width. There is some commented-out code in the script that shows how the expected histogram can be plotted using the scaled PDF. But since the CDF is also available for the lognormal distribution, you might as well use it.


