How can I extract local variables from a stack trace?
Asked Answered
T

3

11

Suppose I have a function that raises unexpected exceptions, so I wrap it in ipdb:

def boom(x, y):
    try:
        x / y
    except Exception as e:
        import ipdb; ipdb.set_trace()

def main():
    x = 2
    y = 0
    boom(x, y)

if __name__ == '__main__':
    main()

I can move up the stack to find out what values x and y have:

$ python crash.py 
> /tmp/crash.py(6)boom()
      5     except Exception as e:
----> 6         import ipdb; ipdb.set_trace()
      7 

ipdb> u
> /tmp/crash.py(11)main()
     10     y = 0
---> 11     boom(x, y)
     12 

ipdb> p y
0

However, when debugging, I want to just put a debugger at the top level:

def boom(x, y):
    x / y

def main():
    x = 2
    y = 0
    boom(x, y)

if __name__ == '__main__':
    try:
        main()
    except Exception as e:
        import ipdb; ipdb.set_trace()

I can display the traceback, but I can't view the variables inside the function called:

$ python crash.py 
> /tmp/crash.py(14)<module>()
     12         main()
     13     except Exception as e:
---> 14         import ipdb; ipdb.set_trace()

ipdb> !import traceback; traceback.print_exc(e)
Traceback (most recent call last):
  File "crash.py", line 12, in <module>
    main()
  File "crash.py", line 8, in main
    boom(x, y)
  File "crash.py", line 3, in boom
    x / y
ZeroDivisionError: integer division or modulo by zero
ipdb> d # I want to see what value x and y had!
*** Newest frame

The exception object clearly still has references to the stack when the exception occurred. Can I access x and y here, even though the stack has unwound?

Thormora answered 12/4, 2016 at 16:54 Comment(0)
T
5

Turns out that it is possible to extract variables from a traceback object.

To manually extract values:

ipdb> !import sys
ipdb> !tb = sys.exc_info()[2]
ipdb> p tb.tb_next.tb_frame.f_locals
{'y': 0, 'x': 2}

Even better, you can use an exception to explicitly do post-mortem debugging on that stack:

import sys

def boom(x, y):
    x / y

def main():
    x = 2
    y = 0
    boom(x, y)

if __name__ == '__main__':
    try:
        main()
    except Exception as e:
        # Most debuggers allow you to just do .post_mortem()
        # but see https://github.com/gotcha/ipdb/pull/94
        tb = sys.exc_info()[2]
        import ipdb; ipdb.post_mortem(tb)

Which gets us straight to the offending code:

> /tmp/crash.py(4)boom()
      3 def boom(x, y):
----> 4     x / y
      5 

ipdb> p x
2
Thormora answered 12/4, 2016 at 17:3 Comment(0)
S
1

You can also use the context manager

with ipdb.launch_ipdb_on_exception():
    main()

It's an easy-to-use wrapper using ipdb.post_mortem.

Slunk answered 2/8, 2019 at 15:52 Comment(0)
I
0

Depending on what you need, there are 2 general best practices.

Just print the variables with minimal code edits

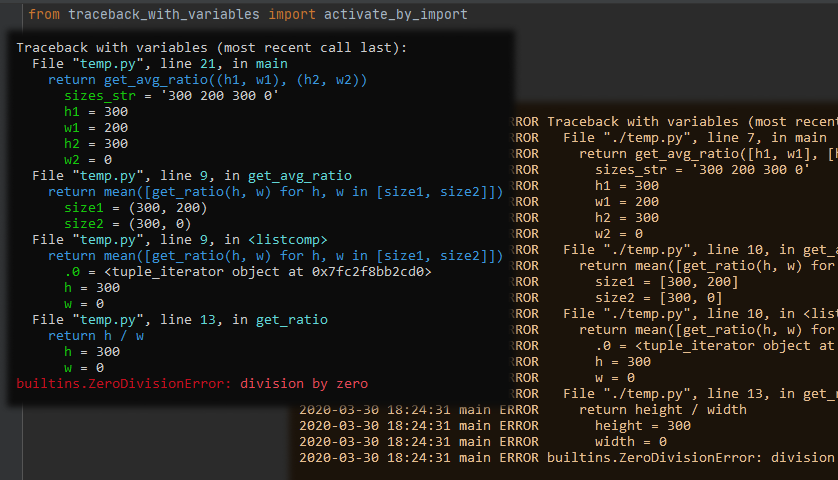
Have a look at some related packages. For simple usage you might pick traceback-with-variables (pip install traceback-with-variables), here is it's postcard

enter image description here

Or try tbvaccine, or better-exceptions, or any other package

Programmatically access variables to use them in your code

Use inspect module

except ... as ...:
    x = inspect.trace()[-1][0].f_locals['x']

What about debugger?

Debugger is made for step-by-step execution and breakpoints. Using it to inspect exception reasons is really inconvenient and should be avoided. You can automate your debug session using two mentioned best practices.

Intimate answered 30/10, 2020 at 8:23 Comment(1)
OP is asking about a specific introspection facility. "Just print" doesn't answer the question. The "what about debugger" part is just wrong - this is exactly what post mortem debugging sessions are for; see pdb.pm(). The packages you mention actually use the mechanics presented in the accepted answer, but they in no way make it easier to inspect the traceback frames programmatically...Milner

© 2022 - 2024 — McMap. All rights reserved.