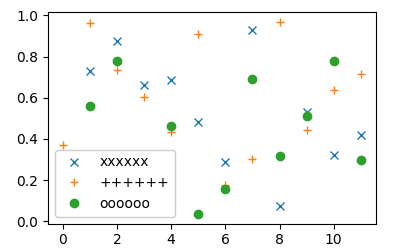
An idea to export the legend handles to a file would be to save the created figure as pdf but crop it to the part of interest.
This can be done by specifying a bounding box bbox to the bbox_inches argument within the call to savefig
plt.savefig("file.pdf", dpi="figure", bbox_inches=bbox )
Now we just need to find out the bounding box to use. This can be done by finding the DrawingArea for each of the legend handles and transform its bounding box to coordinates in inches. This is done in a function export_legend_handles in the code below.
Unfortunately, while writing that code, I found that the marker may acutally exceed the DrawingArea. Since I haven't found an automatic way to find the real size of the handle outside the DrawingArea, one may need to extend/shrink the bounding box manually by some pixels. For this purpose, the below function has a parameter d which allows to set those pixel offsets and for this test case I have already put some decent values in.
import matplotlib.pyplot as plt
import numpy as np; np.random.seed(422)

x = np.arange(12)
a = np.random.rand(len(x), 3)

markers=["x", "+", "o"]
fig, ax = plt.subplots()
for i in range(a.shape[1]):
    ax.plot(x, a[:,i], linestyle="", marker=markers[i], label=markers[i]*6)

leg = ax.legend(framealpha=1)

def export_legend_handles(fig, leg, filename=None, ext=[".pdf", ".png"], d = [0,0,0,3]):
    """ d = [left, bottom, right, top] pixel to add in the respective dimension """
    import matplotlib.transforms as mtransforms
    boxes = []
    fig.canvas.draw()
    trans = fig.dpi_scale_trans.inverted()
    for vpack in leg._legend_handle_box.get_children():
        for hpack in vpack.get_children():
            drawbox = hpack.get_children()[0]
            w, h, xd, yd = drawbox.get_extent(fig.canvas.get_renderer())
            ox, oy = drawbox.get_offset()
            pixbox = mtransforms.Bbox.from_bounds(ox-d[0],oy-d[1],w+d[0]+d[2],h+d[1]+d[3])
            inchbox = pixbox.transformed(trans)
            boxes.append(inchbox)

    filename = filename if filename else __file__[:-3]
    for i, box in enumerate(boxes):
        for ex in ext:
            plt.savefig(filename+str(i)+ex, dpi="figure", bbox_inches=box)

export_legend_handles(fig, leg, d = [-5,0,-5,3])
plt.show()
This produces a plot like the following
![enter image description here]()
and saves the legend handles as pdf and png images, which then look as follows
![enter image description here]()


linestyles=["-", "-", "-"]and by replacingmarker=markers[i]withlinestyle=linestyles[i]. Placing the three pdfs that are produced side by side you will notice that the three lines are at different heights. The difference is subtle here, but it is huge in another plot of mine. – Chiropteran