Integrate New Relic with Spring Boot using Micrometer
Asked Answered
H

2

2

I am trying to integrate a simple Spring Boot Application with New Relic using Micrometer.

Here are the configurations details:-

application.properties

management.endpoints.web.exposure.include=*
management.endpoint.health.show-details=always

management.metrics.export.newrelic.enabled=true
management.metrics.export.newrelic.api-key:MY_API_KEY // Have added the API key here
management.metrics.export.newrelic.account-id: MY_ACCOUNT_ID // Have added the account id here
logging.level.io.micrometer.newrelic=TRACE

pom.xml

<?xml version="1.0" encoding="UTF-8"?>
<project xmlns="http://maven.apache.org/POM/4.0.0"
    xmlns:xsi="http://www.w3.org/2001/XMLSchema-instance"
    xsi:schemaLocation="http://maven.apache.org/POM/4.0.0 https://maven.apache.org/xsd/maven-4.0.0.xsd">
    <modelVersion>4.0.0</modelVersion>
    <parent>
        <groupId>org.springframework.boot</groupId>
        <artifactId>spring-boot-starter-parent</artifactId>
        <version>2.5.5</version>
        <relativePath /> <!-- lookup parent from repository -->
    </parent>
    <groupId>springboot.micrometer.demo</groupId>
    <artifactId>micrometer-new-relic</artifactId>
    <version>0.0.1-SNAPSHOT</version>
    <name>micrometer-new-relic</name>
    <description>Demo project for actuator integration with new relic using micrometer</description>
    <properties>
        <java.version>1.8</java.version>
    </properties>
    <dependencies>
        <dependency>
            <groupId>org.springframework.boot</groupId>
            <artifactId>spring-boot-starter-actuator</artifactId>
        </dependency>
        <dependency>
            <groupId>org.springframework.boot</groupId>
            <artifactId>spring-boot-starter-web</artifactId>
        </dependency>

        <dependency>
            <groupId>org.springframework.boot</groupId>
            <artifactId>spring-boot-devtools</artifactId>
            <scope>runtime</scope>
            <optional>true</optional>
        </dependency>
        <dependency>
            <groupId>io.micrometer</groupId>
            <artifactId>micrometer-registry-new-relic</artifactId>
        </dependency>
        <dependency>
            <groupId>io.micrometer</groupId>
            <artifactId>micrometer-registry-prometheus</artifactId>
            <scope>runtime</scope>
        </dependency>
        <dependency>
            <groupId>org.springframework.boot</groupId>
            <artifactId>spring-boot-starter-aop</artifactId>
        </dependency>
        <dependency>
            <groupId>org.projectlombok</groupId>
            <artifactId>lombok</artifactId>
            <optional>true</optional>
        </dependency>
        <dependency>
            <groupId>org.springframework.boot</groupId>
            <artifactId>spring-boot-starter-test</artifactId>
            <scope>test</scope>
        </dependency>
    </dependencies>

    <build>
        <plugins>
            <plugin>
                <groupId>org.springframework.boot</groupId>
                <artifactId>spring-boot-maven-plugin</artifactId>
                <configuration>
                    <excludes>
                        <exclude>
                            <groupId>org.projectlombok</groupId>
                            <artifactId>lombok</artifactId>
                        </exclude>
                    </excludes>
                </configuration>
            </plugin>
        </plugins>
    </build>

</project>

I was able to integrate Prometheus with this application using micrometer-registry-prometheus dependency. I had set up Prometheus to run in a Docker container in my local system. I used the following set of commands-

docker pull prom/prometheus
docker run -p 9090:9090 -v D:/Workspaces/STS/server_sent_events_blog/micrometer-new-relic/prometheus.yml:/etc/prometheus/prometheus.yml prom/prometheus

prometheus.yml

global:
  scrape_interval: 4s
  evaluation_interval: 4s

scrape_configs:
  - job_name: 'spring_micrometer'
    metrics_path: '/actuator/prometheus'
    scrape_interval: 5s
    static_configs:
      - targets: ['my_ip_address:8080']

When I navigated to localhost:9090/targets I can see that Prometheus dashboard shows my application details and that it can scrape data from it. And in the dashboard, I can see my custom metrics as well along with other metrics.

So my question is I want to achieve the same thing using New Relic. I have added the micrometer-registry-new-relic pom dependency. I have shared the application.properties file as well. I can see logs in my console saying it is sending data to New Relic-

2021-10-24 12:42:04.889 DEBUG 2672 --- [trics-publisher] i.m.n.NewRelicInsightsApiClientProvider : successfully sent 58 metrics to New Relic.

Questions:

  1. What are the next steps?
  2. Do I need a local running server of New Relic as I did for Prometheus?
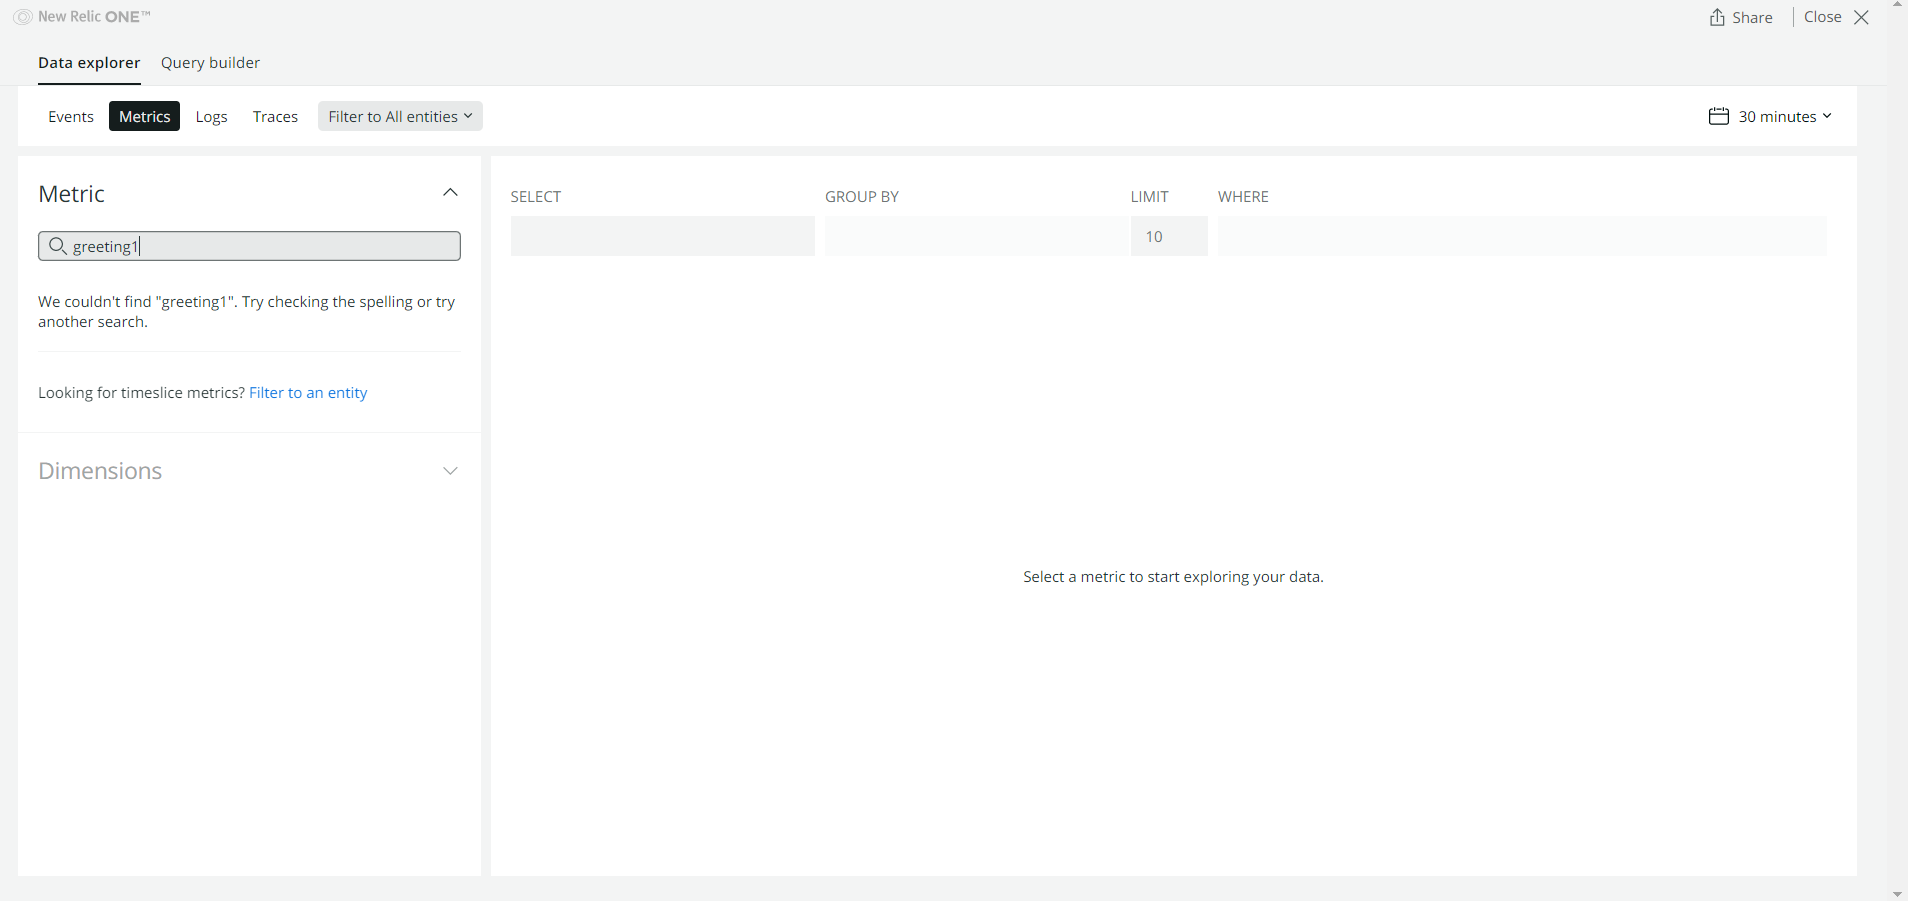
  3. Where can I visualize this data? I have an account in New Relic, I see nothing there

enter image description here

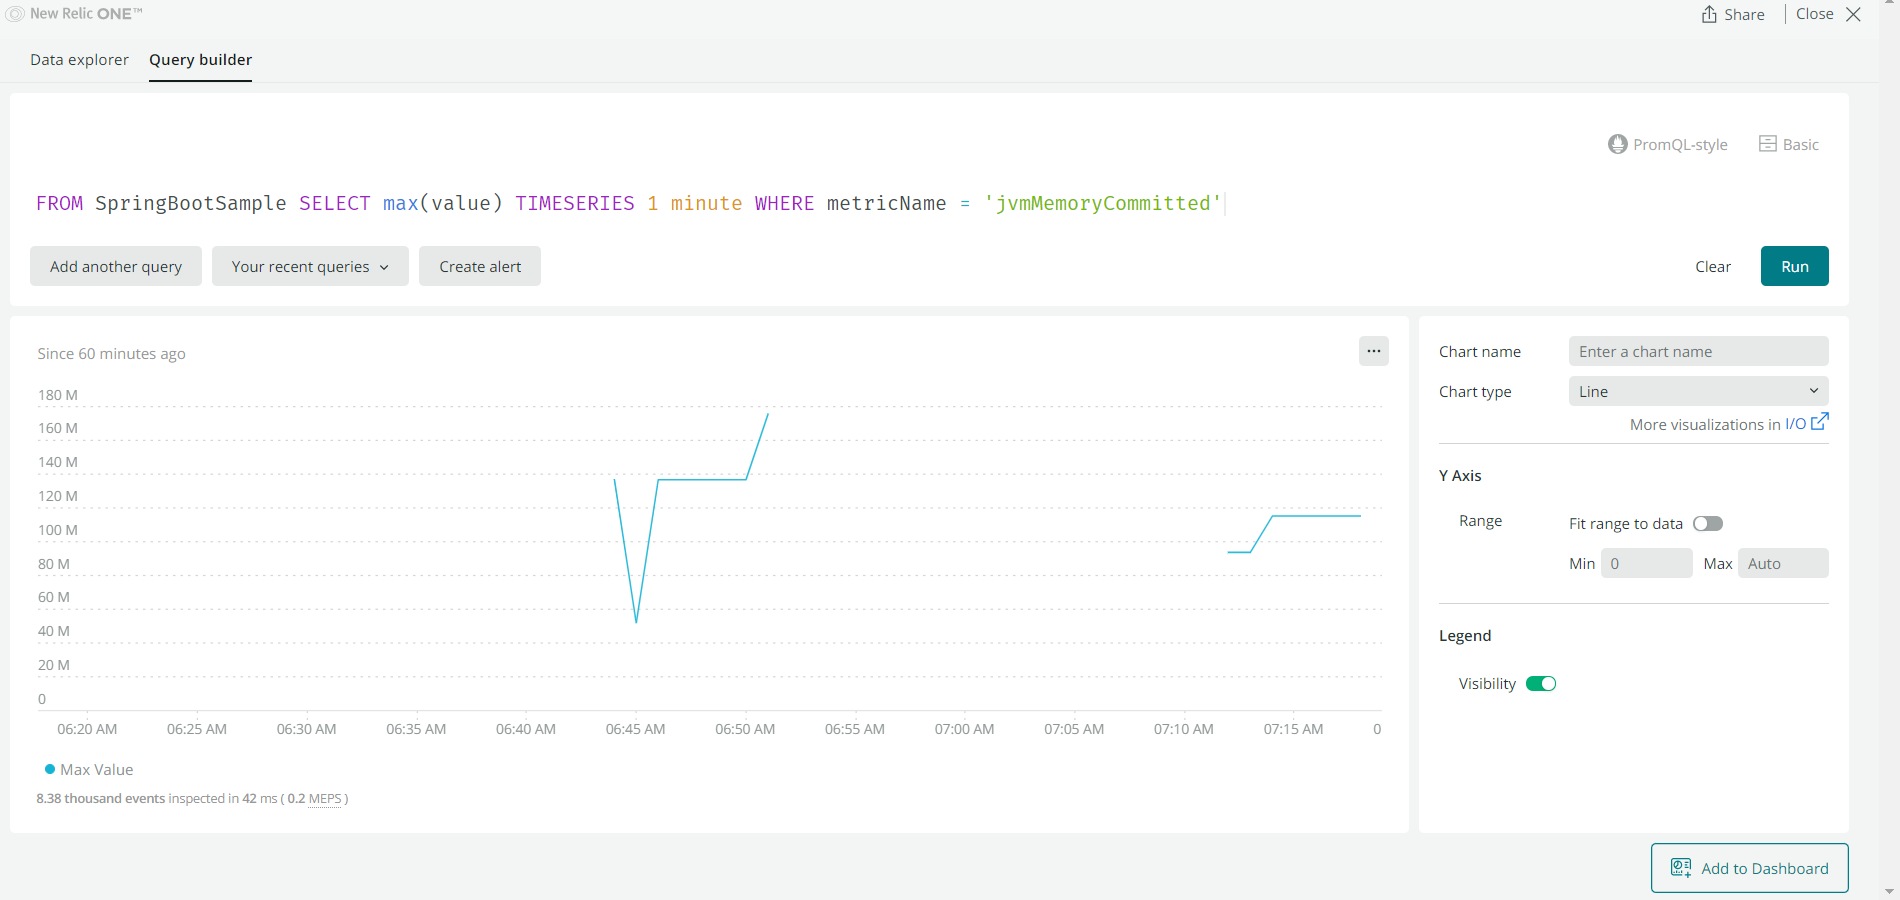
https://discuss.newrelic.com/t/integrate-spring-boot-actuator-with-new-relic/126732 As per the above link, Spring Bootctuator pushes metric as an event type “SpringBootSample”. With NRQL query we can confirm this-

FROM SpringBootSample SELECT max(value) TIMESERIES 1 minute WHERE metricName = 'jvmMemoryCommitted'

enter image description here

  1. What does the result of this query indicate? Is it a metric related to my application?

Here is the GitHub link to the demo that I have shared here. I did not find any clear instructions on this, there are some examples out there but that uses Java agent.

Any kind of help will be highly appreciated.

Hoecake answered 24/10, 2021 at 7:45 Comment(0)
H
4

From what I have learned so far. There are 3 ways to integrate New Relic with a Spring Boot Application-

  1. Using the Java Agent provided by New Relic
  2. Using New Relic's Micrometer Dependency
  3. Micormeter's New Relic Dependency

1. Configuration using Java Agent Provided By New Relic

  1. Download the Java Agent from this URL- https://docs.newrelic.com/docs/release-notes/agent-release-notes/java-release-notes/
  2. Extract it.
  3. Modify the newrelic.yml file inside the extracted folder to inlcude your license_key: app_name:
  4. Create a SpringBoot application with some REST endpoints.
  5. Build the application.
  6. Navigate to the root path where you have extracted the newrelic java agent.
  7. Enter this command java -javagent:<path to your new relic jar>\newrelic.jar -jar <path to your application jar>\<you rapplication jar name>.jar

To view the application metrics-

  1. Log in to your New Relic account.
  2. Go to Explorer Tab.
  3. Click on Services-APM
  4. You can see the name of your application(which you had mentioned in the newrelic.yml file) listed there.
  5. Click on the application name.
  6. The dashboard should look something like this.

image

Using New Relic's Micrometer Dependency is the preferred way to do it.

2. Configuration using New Relic's Micrometer Dependency

  1. Add this dependency
<dependency>
        <groupId>com.newrelic.telemetry</groupId>
        <artifactId>micrometer-registry-new-relic</artifactId>
        <version>0.7.0</version>
    </dependency>
  1. Modify the MicrometerConfig.java class to add your API Key and Application name.
import java.net.InetAddress;
import java.net.UnknownHostException;

import org.springframework.boot.actuate.autoconfigure.metrics.CompositeMeterRegistryAutoConfiguration;
import org.springframework.boot.actuate.autoconfigure.metrics.MetricsAutoConfiguration;
import org.springframework.boot.actuate.autoconfigure.metrics.export.simple.SimpleMetricsExportAutoConfiguration;
import org.springframework.boot.autoconfigure.AutoConfigureAfter;
import org.springframework.boot.autoconfigure.AutoConfigureBefore;
import org.springframework.boot.autoconfigure.condition.ConditionalOnClass;
import org.springframework.context.annotation.Bean;
import org.springframework.context.annotation.Configuration;

import com.newrelic.telemetry.Attributes;
import com.newrelic.telemetry.micrometer.NewRelicRegistry;
import com.newrelic.telemetry.micrometer.NewRelicRegistryConfig;

import java.time.Duration;
import io.micrometer.core.instrument.config.MeterFilter;
import io.micrometer.core.instrument.util.NamedThreadFactory;

@Configuration
@AutoConfigureBefore({ CompositeMeterRegistryAutoConfiguration.class, SimpleMetricsExportAutoConfiguration.class })
@AutoConfigureAfter(MetricsAutoConfiguration.class)
@ConditionalOnClass(NewRelicRegistry.class)
public class MicrometerConfig {

    @Bean
    public NewRelicRegistryConfig newRelicConfig() {
        return new NewRelicRegistryConfig() {
            @Override
            public String get(String key) {
                return null;
            }

            @Override
            public String apiKey() {
                return "your_api_key"; // for production purposes take it from config file
            }

            @Override
            public Duration step() {
                return Duration.ofSeconds(5);
            }

            @Override
            public String serviceName() {
                return "your_service_name"; // take it from config file
            }

        };
    }

    @Bean
    public NewRelicRegistry newRelicMeterRegistry(NewRelicRegistryConfig config) throws UnknownHostException {
        NewRelicRegistry newRelicRegistry = NewRelicRegistry.builder(config)
                .commonAttributes(new Attributes().put("host", InetAddress.getLocalHost().getHostName())).build();
        newRelicRegistry.config().meterFilter(MeterFilter.ignoreTags("plz_ignore_me"));
        newRelicRegistry.config().meterFilter(MeterFilter.denyNameStartsWith("jvm.threads"));
        newRelicRegistry.start(new NamedThreadFactory("newrelic.micrometer.registry"));
        return newRelicRegistry;
    }
}
  1. Run the application.

To view the Application metrics-

  1. Log in to your New Relic account.
  2. Go to Explorer Tab.
  3. Click on Services-OpenTelemetry
  4. You can see the name of your application(which you had mentioned in the MicrometerConfig file) listed there.
  5. Click on the application name.
  6. The dashboard should look something like this.

image

Hoecake answered 12/1, 2022 at 11:52 Comment(0)
B
0
  1. What are the next steps?
    It seems you are done and successfully shipped metrics to NewRelic.

  2. Do I need a local running server of New Relic as I did for Prometheus?
    No, NewRelic is a SaaS offering.

  3. Where can I visualize this data? I have an account in New Relic, I see nothing there
    It seems you already found it (screenshot).

  4. What does the result of this query indicate? Is it a metric related to my application?
    From the screenshot, I can't tell if it is your application but this seems to be the jvm.memory.committed metric pushed by a Spring Boot app (so likely).

In order to see if this is your app or not, you can add common tags which can tell the name of the app and some kind of an instance ID (or hostname?) in case you have multiple instances from the same app, see:

Boggs answered 26/10, 2021 at 18:38 Comment(3)
I am not able to see the application name under the Explorer Tab of New Relic. When I configured using Java agent, I needed to add my license key and an application name in the newrelic.yml file, that same name showed up under the Explorer Tab. Then I could set up custom alerts, and whenever my rest endpoints were hit, the metrics were reflected there. None of this is happening with the current setup with micrometer. So, I think it has not been connected to my New Relic account yet, or some more configuration needs to be done.Hoecake
Did you add the app name as a tag as I showed above?Boggs
Yes, I have added the app name as a tag as you showed management.metrics.tags.application= Old Micrometer App, still it does not work. However, I have found a workaround using new relics micrometer dependency which uses ` New Relic Java Telemetry SDK.` Using that I can see my app name under the Explorer>Services-Open Telemetry. But using the Java Agent the app landed under Explorer>APM. Now the issue I am facing is, I am able to see the rest endpoints metrics(Avergae,count,sum,max,min) under Explorer>Data>Metrics, but I do not see that data in the Explorer>Summary.Hoecake

© 2022 - 2024 — McMap. All rights reserved.