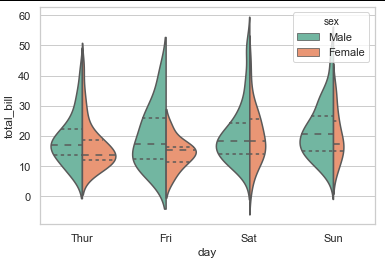
trying to figure out how to modify the line properties (color, thickness, style etc) of the quartiles in a seaborn violinplot.
Example code from their website:
import seaborn as sns

sns.set(style="whitegrid")

tips = sns.load_dataset("tips")

ax = sns.violinplot(x="day", y="total_bill", hue="sex",

                    data=tips, palette="Set2", split=True,linestyle=':',

                    scale="count", inner="quartile")
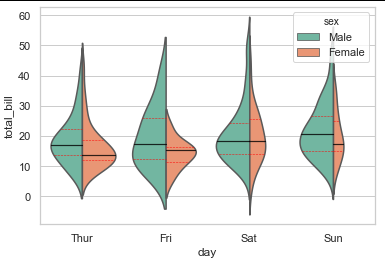
The desired outcome would be to be able to change e.g. the color of the two parts of the violinplot individually as for example like this to improve readability:
How can I do this?
Thankful for any insights
UPDATE: Based on the response by @kynnem the following can be used to change the median and quartile lines separately:
import seaborn as sns

sns.set(style="whitegrid")

tips = sns.load_dataset("tips")

ax = sns.violinplot(x="day", y="total_bill", hue="sex",

                    data=tips, palette="Set2", split=True,linestyle=':',

                    scale="count", inner="quartile")
for l in ax.lines:
    l.set_linestyle('--')
    l.set_linewidth(0.6)
    l.set_color('red')
    l.set_alpha(0.8)
for l in ax.lines[1::3]:
    l.set_linestyle('-')
    l.set_linewidth(1.2)
    l.set_color('black')
    l.set_alpha(0.8)
Result:


