Normalizing FFT spectrum magnitude to 0dB
Asked Answered
B

1

11

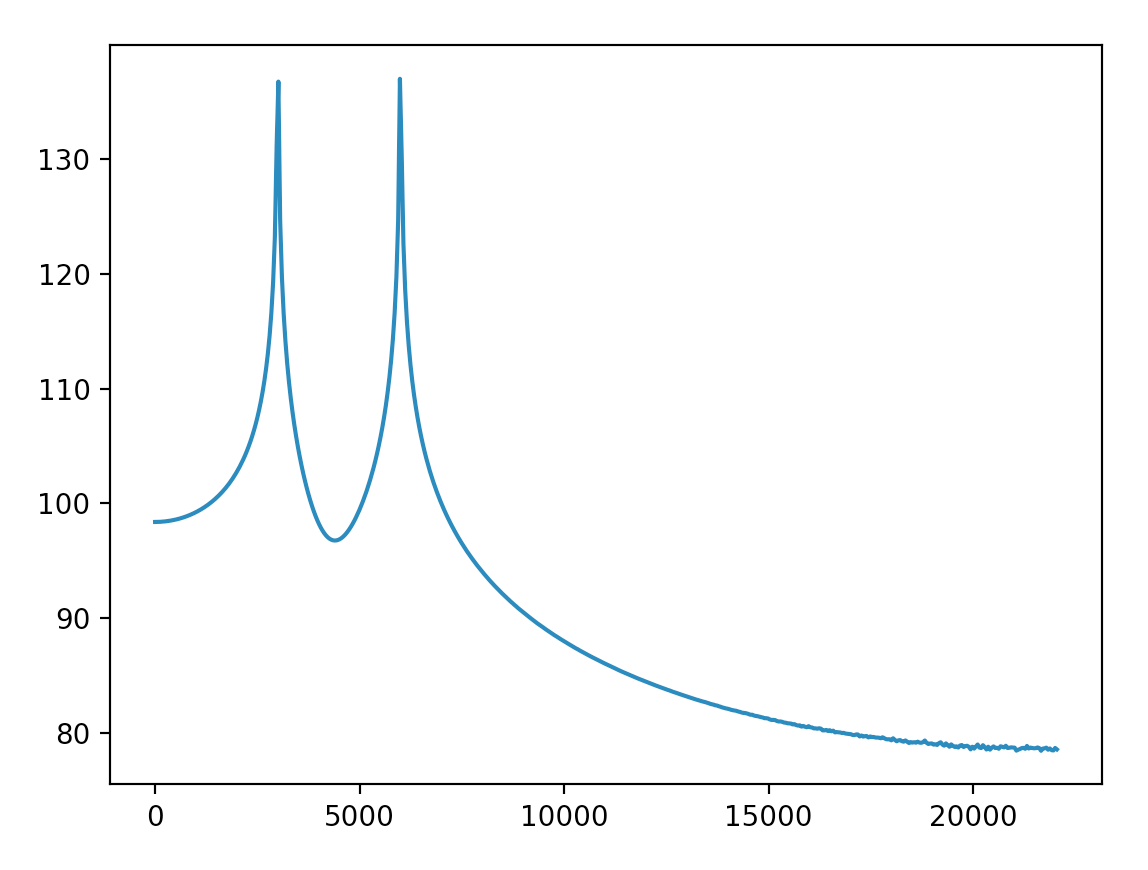
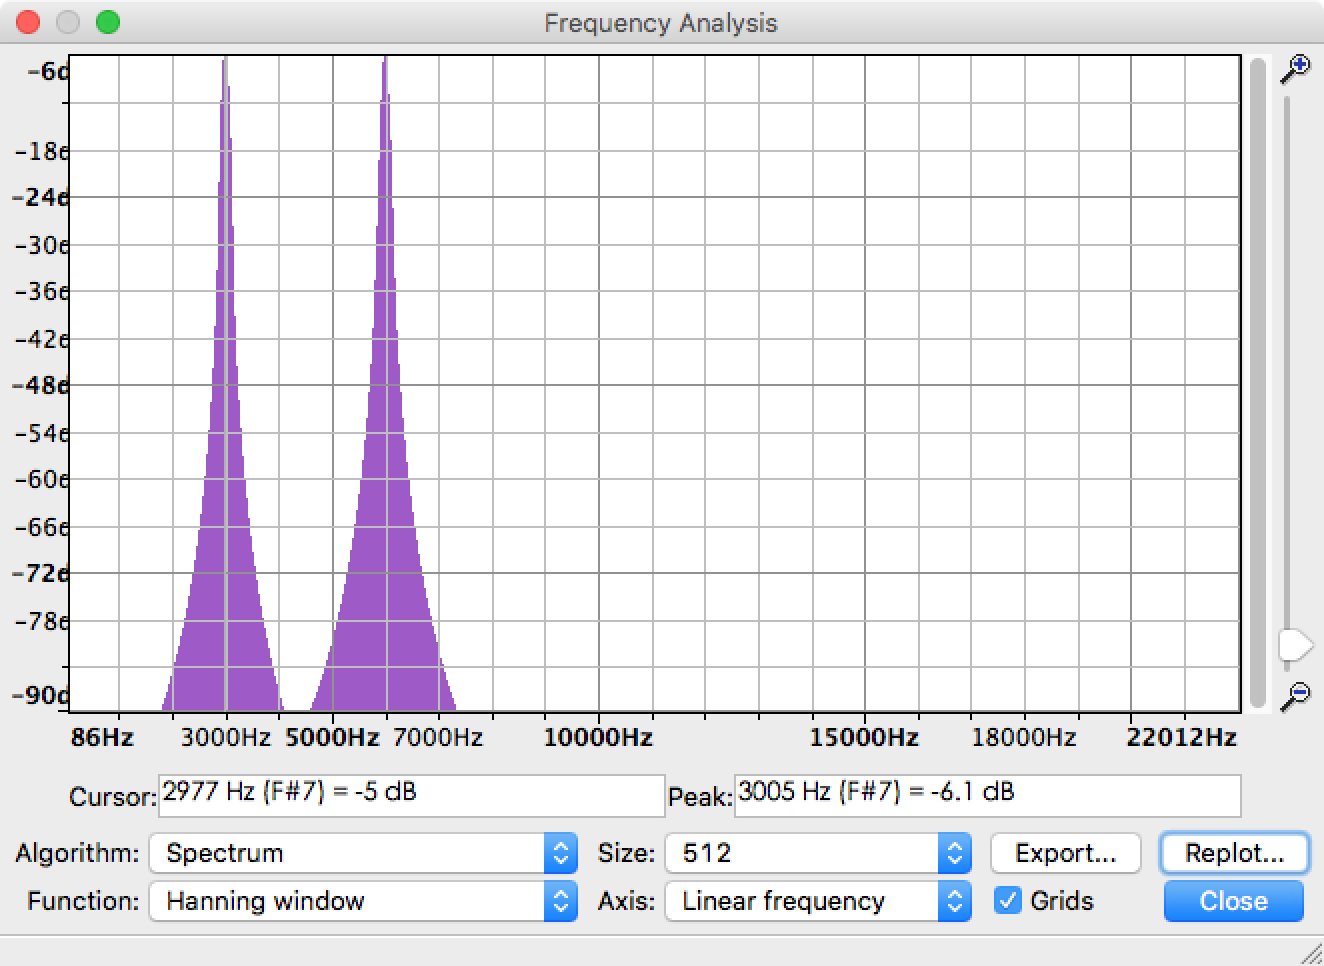
I'm using FFT to extract the amplitude of each frequency components from an audio file. Actually, there is already a function called Plot Spectrum in Audacity that can help to solve the problem. Taking this example audio file which is composed of 3kHz sine and 6kHz sine, the spectrum result is like the following picture. You can see peaks are at 3KHz and 6kHz, no extra frequency.

enter image description here

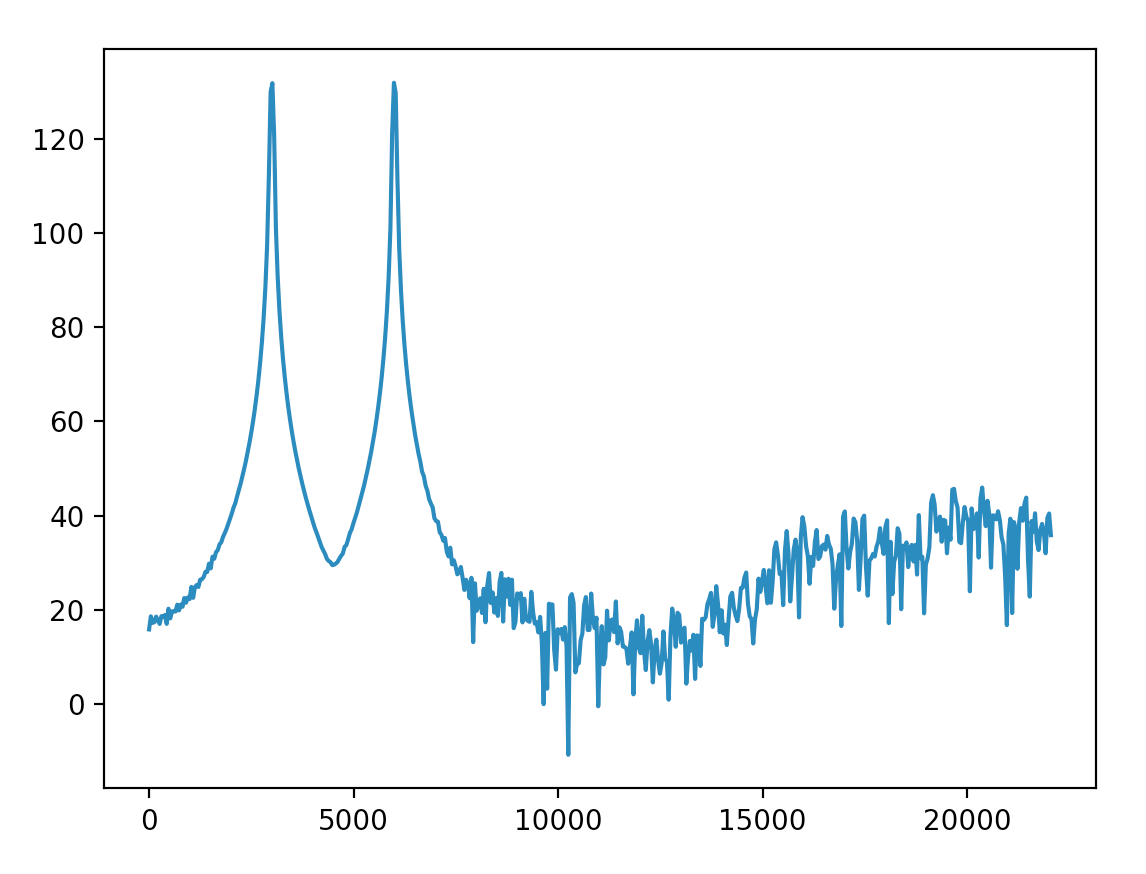
Now I need to implement the same function and plot the similar result in Python. I'm close to the Audacity result with the help of rfft but I still have problems to solve after getting this result.

enter image description here

  1. What's physical meaning of the amplitude in the second picture?
  2. How to normalize the amplitude to 0dB like the one in Audacity?
  3. Why do the frequency over 6kHz have such high amplitude (≥90)? Can I scale those frequency to relative low level?

Related code:

import numpy as np
from pylab import plot, show
from scipy.io import wavfile

sample_rate, x = wavfile.read('sine3k6k.wav')
fs = 44100.0

rfft = np.abs(np.fft.rfft(x))
p = 20*np.log10(rfft)
f = np.linspace(0, fs/2, len(p))

plot(f, p)
show()

Update

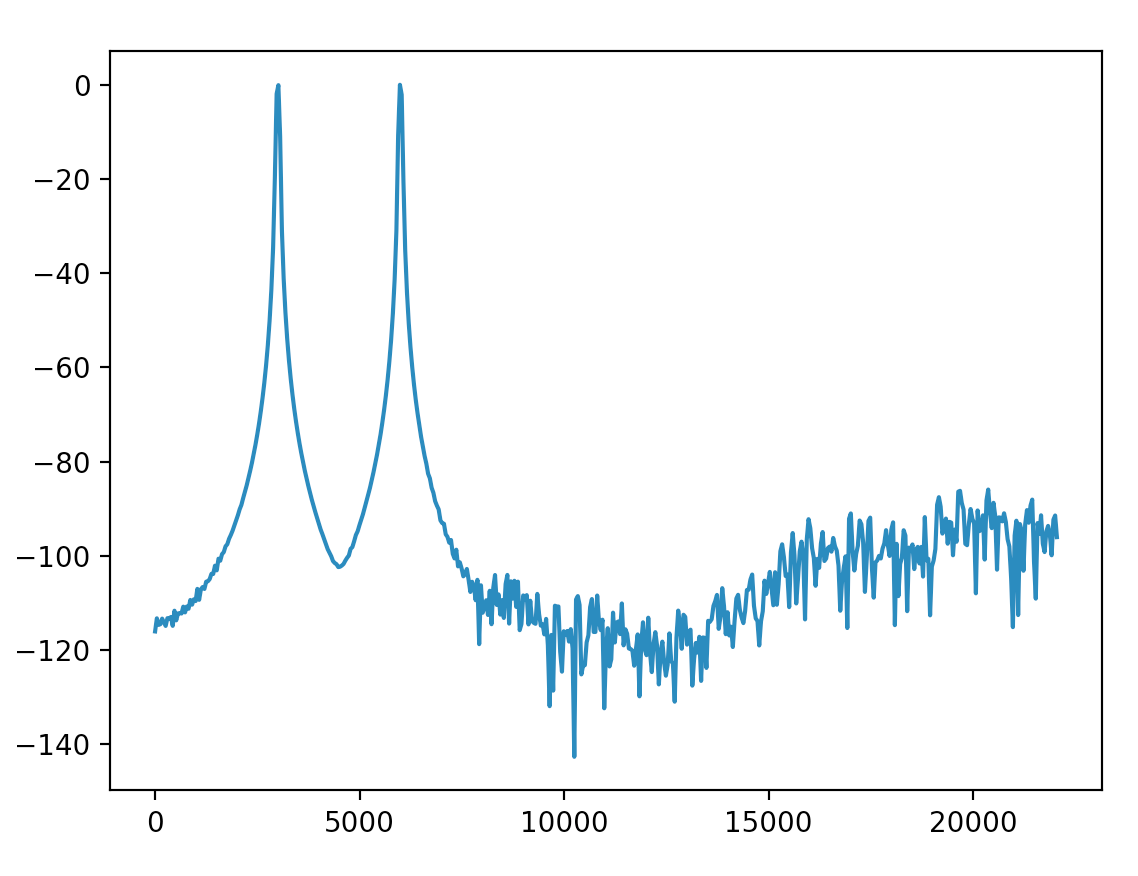
I multiplied Hanning window with the whole length signal (is that correct?) and get this. Most of the amplitude of skirts are below 40.

enter image description here

And scale the y-axis to decibel as @Mateen Ulhaq said. The result is more close to the Audacity one. Can I treat the amplitude below -90dB so low that it can be ignored?

Updated code:

fs, x = wavfile.read('input/sine3k6k.wav')
x = x * np.hanning(len(x))

rfft = np.abs(np.fft.rfft(x))
rfft_max = max(rfft)
p = 20*np.log10(rfft/rfft_max)
f = np.linspace(0, fs/2, len(p))

enter image description here


About the bounty

With the code in the update above, I can measure the frequency components in decibel. The highest possible value will be 0dB. But the method only works for a specific audio file because it uses rfft_max of this audio. I want to measure the frequency components of multiple audio files in one standard rule just like Audacity does.

I also started a discussion in Audacity forum, but I was still not clear how to implement my purpose.

Barry answered 27/6, 2018 at 7:51 Comment(15)
1. What do you mean? It's just how much of that frequency component is present in the audio sample.Callipygian
2. Find the max amplitude your wavefile can represent. (I'm guessing either 1, 128, or 256.) Take the 20 log of this, then use that as your 0 dB reference point.Callipygian
3. If you want to keep only the peaks, threshold away values below e.g. 130. Also, I recommend this 3blue1brown video. It'll show you why nearby frequencies (like 6kHz) also produce a large correlative response.Callipygian
@MateenUlhaq Thanks! I will try your 2nd advice. But it is not proper to set the threshold as a magic number because I need a general method. I'm wondering if I missed something when doing fft.Barry
If you apply a window function prior to the FFT you will get rid of most of the "skirts" around your peaks.Lung
Also rfft = np.abs(np.fft.rfft(x)) -> rfft = np.abs(np.fft.rfft(x)) / len(x) (to deal with the implicit scale factor in the FFT).Lung
@PaulR Thanks Paul. I just followed your method and added the results in the update. Can you review it?Barry
@PaulR Prior? Do you mean after the FFT?Callipygian
@MateenUlhaq: no, "prior to" means before - applying a window function before the FFT helps to remove artefacts (spectral leakage) caused by the discontinuity between the last and first sample.Lung
@WangYudong: the window function looks good, but I think scaling by the max value is not such a good idea - you really need to use a fixed 0 dB reference value. See also my comment above re correcting for the FFT scale factor.Lung
@PaulR I noticed your comment about the scale factor, but can you explain why should rfft be divided by the signal length?Barry
@PaulR And I still don't know how to use a fixed 0dB reference value. I tried to make a single frequency sine wave (e.g. 3kHz) x whose amplitude is in [-1.0, 1.0] and calculate the reference using np.abs(np.fft.rfft(x)) / len(x). But if I applied the reference to another audio, the result has much difference to the spectrum dB in Audacity.Barry
@WangYudong: most FFT implementations have an implicit scale factor of N in the forward direction, where N is the size of the FFT, so you typically need to divide the results by N if you care about absolute magnitude. For any further suggestions you need to describe the type and range of your input data (e.g. is it 16 bit signed audio samples ?).Lung
@PaulR Yes, audio samples are 16 bit signed float numbers, ranged from -1.0 to 1.0. Currently it seems I take the length of samples as N. It should be size like 512, 1024, etc. But I cannot find how to use this size in my code. My purpose is to get strength of frequency components in whole audio files.Barry
It seems to me that Audacity simply clips values below some threshold. I'm sure that picking a standard threshold is OK. Likely they picked the -90dB threshold because it is below auditory threshold? Also, the 0dB reference must be some arbitrarily picked reference point. Something like the strength of a loud but still-pleasant volume. It is just that, a reference.Nowhither
M
10

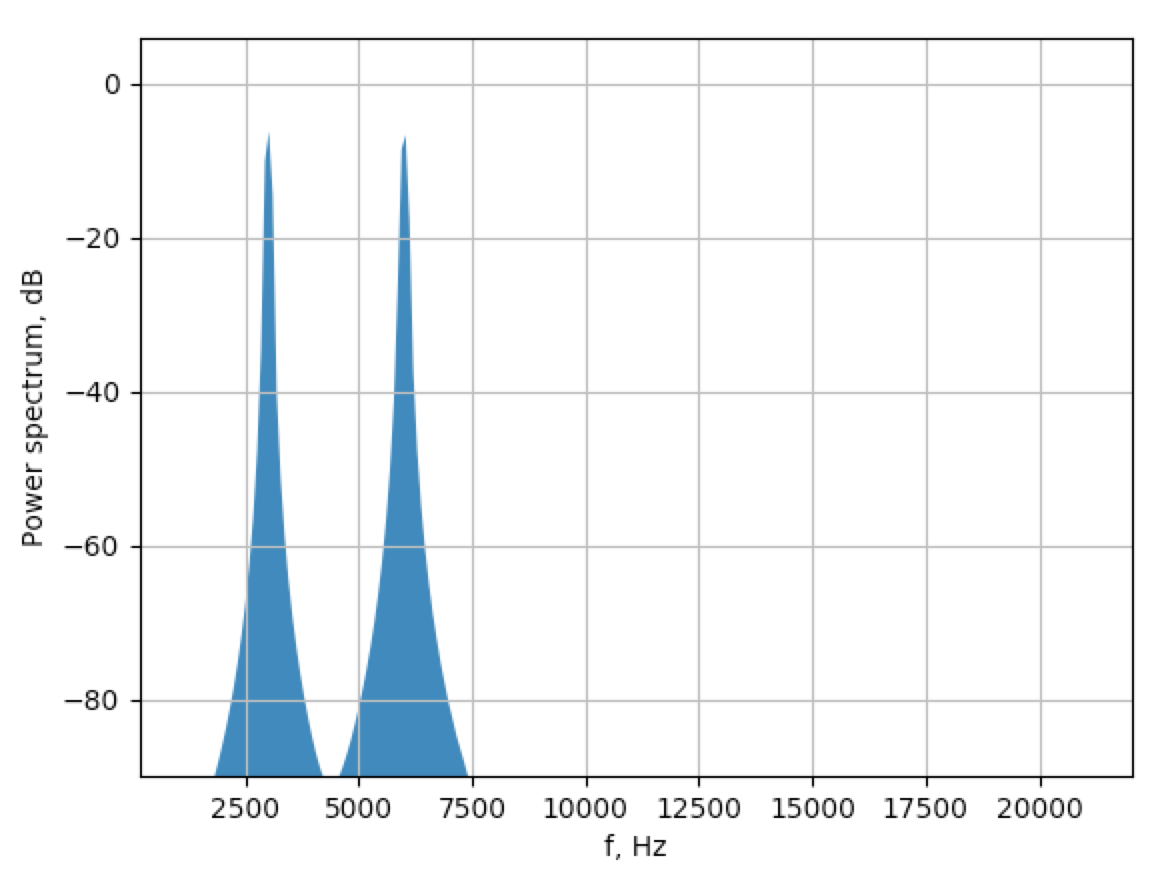
After doing some reverse engineering on Audacity source code here some answers. First, they use Welch algorithm for estimating PSD. In short, it splits signal to overlapped segments, apply some window function, applies FFT and averages the result. Mostly as This helps to get better results when noise is present. Anyway, after extracting the necessary parameters here is the solution that approximates Audacity's spectrogram:

import numpy as np
from scipy.io import wavfile
from scipy import signal
from matplotlib import pyplot as plt

segment_size = 512

fs, x = wavfile.read('sine3k6k.wav')
x = x / 32768.0  # scale signal to [-1.0 .. 1.0]

noverlap = segment_size / 2
f, Pxx = signal.welch(x,                        # signal
                      fs=fs,                    # sample rate
                      nperseg=segment_size,     # segment size
                      window='hanning',         # window type to use
                      nfft=segment_size,        # num. of samples in FFT
                      detrend=False,            # remove DC part
                      scaling='spectrum',       # return power spectrum [V^2]
                      noverlap=noverlap)        # overlap between segments

# set 0 dB to energy of sine wave with maximum amplitude
ref = (1/np.sqrt(2)**2)   # simply 0.5 ;)
p = 10 * np.log10(Pxx/ref)

fill_to = -150 * (np.ones_like(p))  # anything below -150dB is irrelevant
plt.fill_between(f, p, fill_to )
plt.xlim([f[2], f[-1]])
plt.ylim([-90, 6])
# plt.xscale('log')   # uncomment if you want log scale on x-axis
plt.xlabel('f, Hz')
plt.ylabel('Power spectrum, dB')
plt.grid(True)
plt.show()

Some necessary explanations on parameters:

  • wave file is read as 16-bit PCM, in order to be compatible with Audacity it should be scaled to be |A|<1.0
  • segment_size is corresponding to Size in Audacity's GUI.
  • default window type is 'Hanning', you can change it if you want.
  • overlap is segment_size/2 as in Audacity code.
  • output window is framed to follow Audacity style. They throw away first low frequency bins and cut everything below -90dB

enter image description here

What's physical meaning of the amplitude in the second picture?

It is basically amount of energy in the frequency bin.

How to normalize the amplitude to 0dB like the one in Audacity?

You need choose some reference point. Graphs in decibels are always relevant to something. When you select maximum energy bin as a reference, your 0db point is the maximum energy (obviously). It is acceptable to set as a reference energy of the sine wave with maximum amplitude. See ref variable. Power in sinusoidal signal is simply squared RMS, and to get RMS, you just need to divide amplitude by sqrt(2). So the scaling factor is simply 0.5. Please note that factor before log10 is 10 and not 20, this is because we are dealing with power of signal and not amplitude.

Can I treat the amplitude below -90dB so low that it can be ignored?

Yes, anything below -40dB is usually considered negligeble

Myasthenia answered 9/7, 2018 at 7:49 Comment(3)
Great answer! One more thing I want to ask is how to select maximum energy (the ref) in any other normal music/melody and how should I choose the width of energy bin?Barry
Maximum amplitude sine is a common reference. But you are free to choose any other reference.Myasthenia
You can not choose the bin width. Number of bins is defined by the number of FFT samples. The bin "width" is defined as sampling frequency divided by the half the number of FFT samples.Myasthenia

© 2022 - 2024 — McMap. All rights reserved.