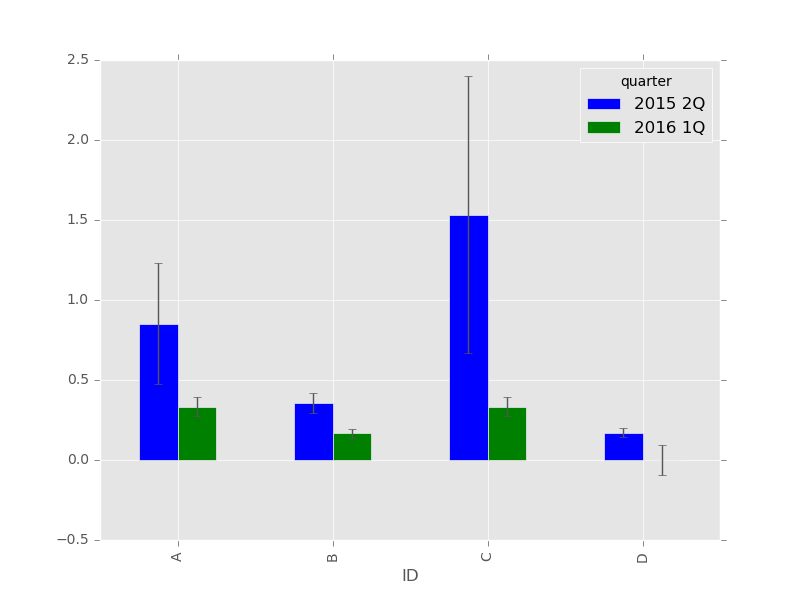
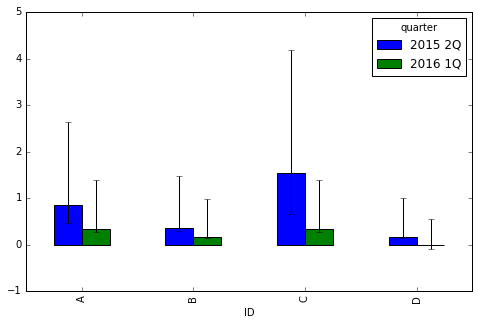
Following the accepted answer to this question I am able to reproduce the same results for my own data. However, I need to plot asymmetric error bars.
dfdict = {'ID': ['A', 'A', 'B', 'B', 'C', 'C', 'D', 'D'],
      'quarter': ['2015 2Q', '2016 1Q', '2015 2Q', '2016 1Q', '2015 2Q',
                  '2016 1Q', '2015 2Q', '2016 1Q'],
      'Percent': [0.851789, 0.333333, 0.355240, 0.167224, 1.533220,
                  0.333333, 0.170358, 0.000000],
      'AgrCoullLower': [ 0.378046, 0.057962,  0.061850, -0.027515,
                         0.866025, 0.057962, -0.028012, -0.092614],
      'AgrCoullUpper': [1.776511, 1.054612, 1.123492, 0.810851,
                        2.645141, 1.054612, 0.825960, 0.541513]}
df = pd.DataFrame(dfdict)
df
  ID  quarter   Percent  AgrCoullLower  AgrCoullUpper
0  A  2015 2Q  0.851789       0.378046       1.776511
1  A  2016 1Q  0.333333       0.057962       1.054612
2  B  2015 2Q  0.355240       0.061850       1.123492
3  B  2016 1Q  0.167224      -0.027515       0.810851
4  C  2015 2Q  1.533220       0.866025       2.645141
5  C  2016 1Q  0.333333       0.057962       1.054612
6  D  2015 2Q  0.170358      -0.028012       0.825960
7  D  2016 1Q  0.000000      -0.092614       0.541513

errLo = df.pivot(index='ID', columns='quarter', values='AgrCoullLower')
errHi = df.pivot(index='ID', columns='quarter', values='AgrCoullUpper')

df.pivot(index='ID', columns='quarter', values='Percent')\
    .plot(kind='bar', yerr=errLo)
As matplotlib allows for asymmetric errorbars using a yerr=[ylo, yhi] construct, I was hoping for something similar here. Unfortunately, it is not possible to simply substitute yerr=[errLo, errHi] since the arrays (having shape (4,2)) cannot be simply inserted this way (stack trace later), Using yerr=np.column_stack((errLo, errHi)) the plot contains symmetric error bars (never using the second array values). Using yerr=np.row_stack((errLo, errHi)), I get
ValueError: yerr must be a scalar, the same dimensions as y, or 2xN.
Is there a way to cajole Pandas into providing grouped, asymmetric errorbars?
That stack trace:
ValueError                                Traceback (most recent call last)
<ipython-input-26-336a22db15e6> in <module>()
----> 1 df.pivot(index='ID', columns='quarter', values='Percent')    .plot(kind='bar', yerr=[errLo, errHi])

/usr/local/lib/python3.4/dist-packages/pandas/tools/plotting.py in __call__(self, x, y, kind, ax, subplots, sharex, sharey, layout, figsize, use_index, title, grid, legend, style, logx, logy, loglog, xticks, yticks, xlim, ylim, rot, fontsize, colormap, table, yerr, xerr, secondary_y, sort_columns, **kwds)
   3669                           fontsize=fontsize, colormap=colormap, table=table,
   3670                           yerr=yerr, xerr=xerr, secondary_y=secondary_y,
-> 3671                           sort_columns=sort_columns, **kwds)
   3672     __call__.__doc__ = plot_frame.__doc__
   3673

/usr/local/lib/python3.4/dist-packages/pandas/tools/plotting.py in plot_frame(data, x, y, kind, ax, subplots, sharex, sharey, layout, figsize, use_index, title, grid, legend, style, logx, logy, loglog, xticks, yticks, xlim, ylim, rot, fontsize, colormap, table, yerr, xerr, secondary_y, sort_columns, **kwds)
   2554                  yerr=yerr, xerr=xerr,
   2555                  secondary_y=secondary_y, sort_columns=sort_columns,
-> 2556                  **kwds)
   2557
   2558

/usr/local/lib/python3.4/dist-packages/pandas/tools/plotting.py in _plot(data, x, y, subplots, ax, kind, **kwds)
   2380                             pass
   2381                 data = series
-> 2382         plot_obj = klass(data, subplots=subplots, ax=ax, kind=kind, **kwds)
   2383
   2384     plot_obj.generate()

/usr/local/lib/python3.4/dist-packages/pandas/tools/plotting.py in __init__(self, data, **kwargs)
   1843
   1844         self.log = kwargs.pop('log',False)
-> 1845         MPLPlot.__init__(self, data, **kwargs)
   1846
   1847         if self.stacked or self.subplots:

/usr/local/lib/python3.4/dist-packages/pandas/tools/plotting.py in __init__(self, data, kind, by, subplots, sharex, sharey, use_index, figsize, grid, legend, rot, ax, fig, title, xlim, ylim, xticks, yticks, sort_columns, fontsize, secondary_y, colormap, table, layout, **kwds)
    904         self.errors = {}
    905         for kw, err in zip(['xerr', 'yerr'], [xerr, yerr]):
--> 906             self.errors[kw] = self._parse_errorbars(kw, err)
    907
    908         if not isinstance(secondary_y, (bool, tuple, list, np.ndarray, Index)):

/usr/local/lib/python3.4/dist-packages/pandas/tools/plotting.py in _parse_errorbars(self, label, err)
   1423             else:
   1424                 # raw error values
-> 1425                 err = np.atleast_2d(err)
   1426
   1427             err_shape = err.shape

/usr/local/lib/python3.4/dist-packages/numpy/core/shape_base.py in atleast_2d(*arys)
     98     res = []
     99     for ary in arys:
--> 100         ary = asanyarray(ary)
    101         if len(ary.shape) == 0:
    102             result = ary.reshape(1, 1)

/usr/local/lib/python3.4/dist-packages/numpy/core/numeric.py in asanyarray(a, dtype, order)
    523
    524     """
--> 525     return array(a, dtype, copy=False, order=order, subok=True)
    526
    527 def ascontiguousarray(a, dtype=None):

ValueError: cannot copy sequence with size 4 to array axis with dimension 2


