I found the easiest to be the new SimFin Python API which lets you download stock-prices and fundamental data, save it to disk, and load it into Pandas DataFrames with only a few lines of code. They have also made several tutorials on how to use their data with other libraries such as statsmodels, scikit-learn, TensorFlow, etc. The basic example below is copied from their github page.
You install the SimFin python package by typing this command in a terminal window (preferably in its own environement, see their full instructions):
pip install simfin
Then you copy-paste the following into a Jupyter Notebook or Python source-file:
import simfin as sf
from simfin.names import *

# Set your API-key for downloading data.
# If the API-key is 'free' then you will get the free data,
# otherwise you will get the data you have paid for.
# See www.simfin.com for what data is free and how to buy more.
sf.set_api_key('free')

# Set the local directory where data-files are stored.
# The dir will be created if it does not already exist.
sf.set_data_dir('~/simfin_data/')

# Load the annual Income Statements for all companies in USA.
# The data is automatically downloaded if you don't have it already.
df = sf.load_income(variant='annual', market='us')

# Print all Revenue and Net Income for Microsoft (ticker MSFT).
print(df.loc['MSFT', [REVENUE, NET_INCOME]])
This produces the following output:
                  Revenue   Net Income
Report Date
2008-06-30   6.042000e+10  17681000000
2009-06-30   5.843700e+10  14569000000
2010-06-30   6.248400e+10  18760000000
2011-06-30   6.994300e+10  23150000000
2012-06-30   7.372300e+10  16978000000
2013-06-30   7.784900e+10  21863000000
2014-06-30   8.683300e+10  22074000000
2015-06-30   9.358000e+10  12193000000
2016-06-30   9.115400e+10  20539000000
2017-06-30   9.657100e+10  25489000000
2018-06-30   1.103600e+11  16571000000
2019-06-30   1.258430e+11  39240000000
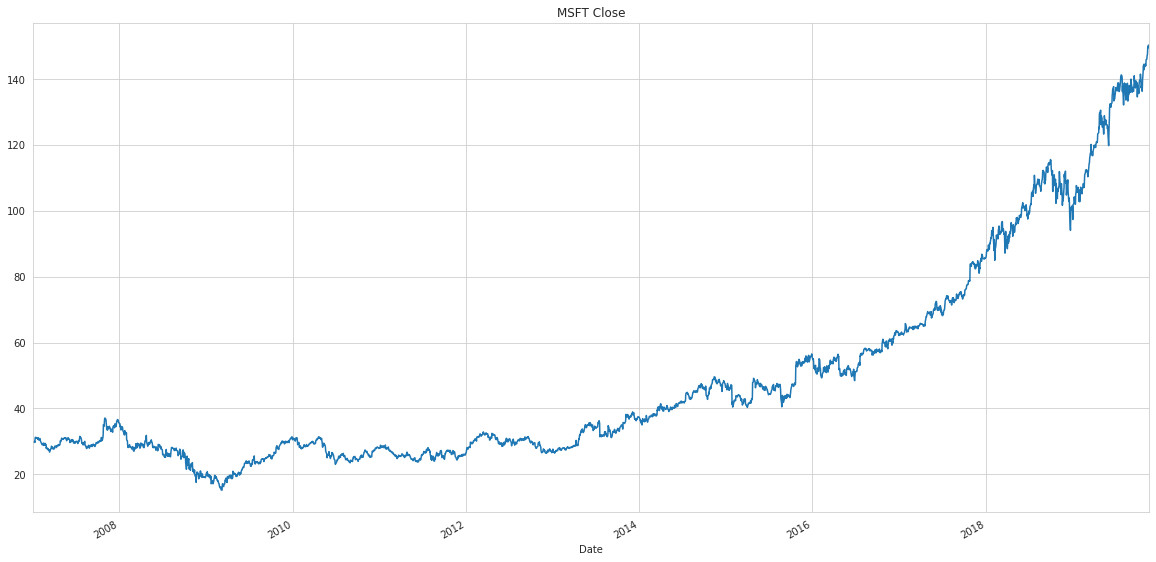
We can also load the daily share-prices and plot the closing share-price for Microsoft (ticker MSFT):
# Load daily share-prices for all companies in USA.
# The data is automatically downloaded if you don't have it already.
df_prices = sf.load_shareprices(market='us', variant='daily')

# Plot the closing share-prices for ticker MSFT.
df_prices.loc['MSFT', CLOSE].plot(grid=True, figsize=(20,10), title='MSFT Close')
This produces the following image:
![MSFT Share-Price Close]()


a = [float(f.close_price.values[i].encode('ascii')) for i in range(len(f.close_price.values))] f = pd.Series(a, f.begins_at.values)# morningstar discontinued --> change to robinhood – Runagate