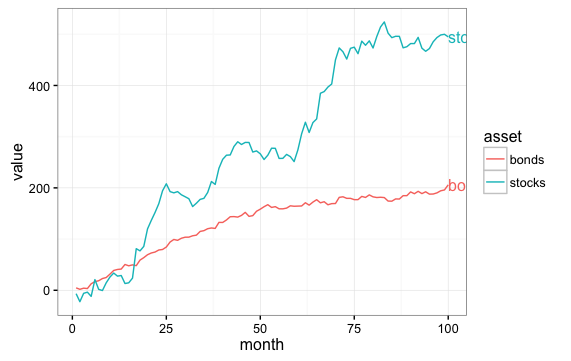
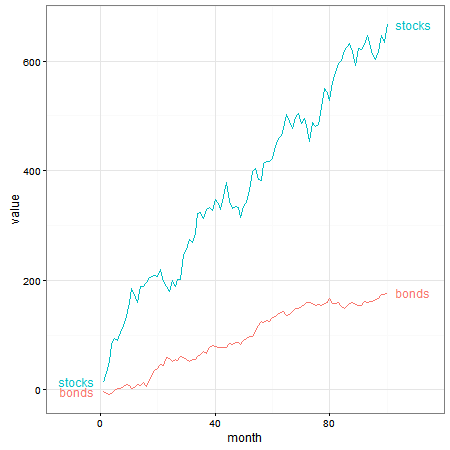
I want to explore the directlabels package with ggplot. I am trying to plot labels at the endpoint of a simple line chart; however, the labels are clipped by the plot panel. (I intend to plot about 10 financial time series in one plot and I thought directlabels would be the best solution.)
I would imagine there may be another solution using annotate or some other geoms. But I would like to solve the problem using directlabels. Please see code and image below. Thanks.
library(ggplot2)
library(directlabels)
library(tidyr)

#generate data frame with random data, for illustration and plot:
x <- seq(1:100)
y <- cumsum(rnorm(n = 100, mean = 6, sd = 15))
y2 <- cumsum(rnorm(n = 100, mean = 2, sd = 4))
data <- as.data.frame(cbind(x, y, y2))
names(data) <- c("month", "stocks", "bonds")
tidy_data <- gather(data, month)
names(tidy_data) <- c("month", "asset", "value")
p <- ggplot(tidy_data, aes(x = month, y = value, colour = asset)) +
geom_line() +
geom_dl(aes(colour = asset, label = asset), method = "last.points") +
theme_bw()
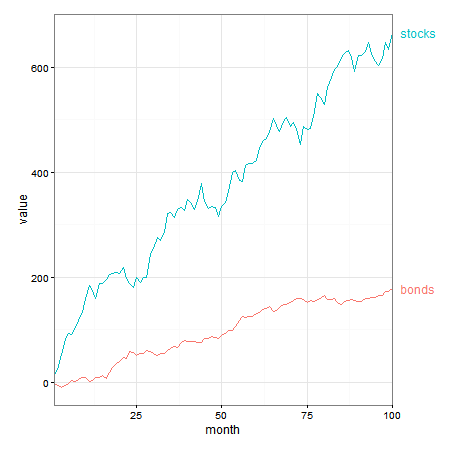
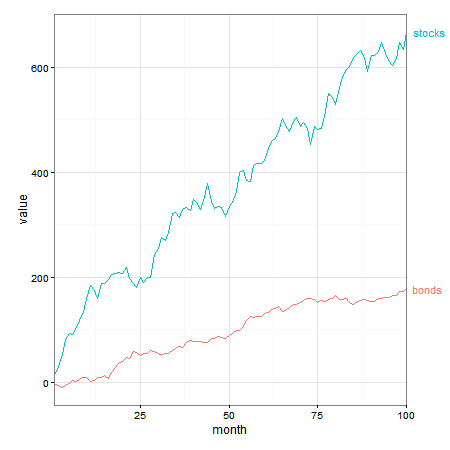
On data visualization principles, I would like to avoid extending the x-axis to make the labels fit--this would mean having data space with no data. Rather, I would like the labels to extend toward the white space beyond the chart box/panel (if that makes sense).


