Here's my current code
values = pd.Series([False, False, True, True])
v_counts = values.value_counts()
fig = plt.figure()
plt.pie(v_counts, labels=v_counts.index, autopct='%.4f', shadow=True);
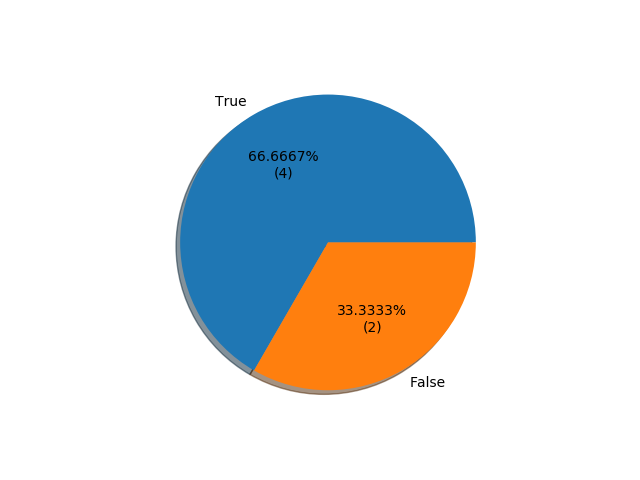
Currently, it shows only the percentage (using autopct)
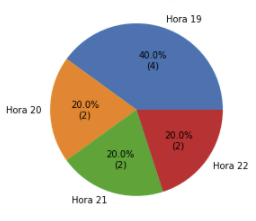
I'd like to present both the percentage and the actual value (I don't mind about the position)


plt.pie(v_counts, labels=v_counts.index, autopct=autopct_format(values))– Isabeau