When I'm trying to make 3D plots in JupyterLab using plotly, I sometimes get the error message:
WebGL is not supported by your browser - visit https://get.webgl.org for more info
What is going on here? Similar questions have been asked for
but none seem to be asked specifically for JupyterLab, so I'm hoping some of you have an idea why this error occurs.
The details:
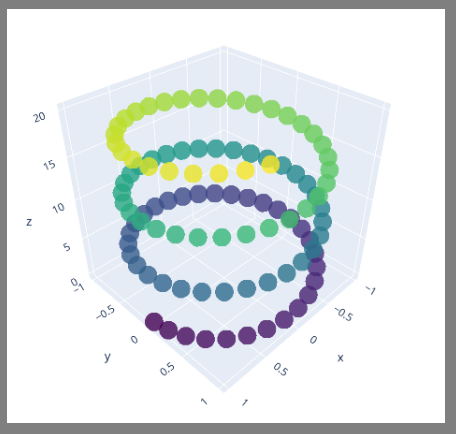
I'm running different tests on the following script that produces the plot below:
Code:
import plotly.graph_objects as go
import numpy as np

# Helix equation
t = np.linspace(0, 20, 100)
x, y, z = np.cos(t), np.sin(t), t

fig = go.Figure(data=[go.Scatter3d(
    x=x,
    y=y,
    z=z,
    mode='markers',
    marker=dict(
        size=12,
        color=z,                # set color to an array/list of desired values
        colorscale='Viridis',   # choose a colorscale
        opacity=0.8
    )
)])

# tight layout
fig.update_layout(margin=dict(l=0, r=0, b=0, t=0))
fig.show()
Plot:
Seemingly depending on what I'm trying to do here, the above mentioned error occurs from time to time. And that's what bothers me the most; there just does not seem to be a clear pattern here. Sometimes the plot is displayed briefly, and then the error message pops up. And other times it just completely breaks. And when it first breaks, restarting the kernel does not help. Neither does launching JupyterLab again. The only thing that helps is to restart the computer.
When I click the error message in JupyterLab:
I'm being directed to https://get.webgl.org/ that displays:
And that's not exaclty very helpful? Any ideas anyone?
System info:
Plotly 4.2.0
JupyterLab Version 0.34.9
Python 3.7.0 (default, Jun 28 2018, 08:04:48) [MSC v.1912 64 bit (AMD64)]
Chrome 77 on Windows 7, 64 bit ( not that that should matter?)


