Firstly, if you want to represent an array of 13 coefficients as a single point in your graph, then you need to break the 13 coefficients down to the number of dimensions in your graph as yan king yin pointed out in his comment.
For projecting your data into 2 dimensions you can either create relevant indicators yourself such as max/min/standard deviation/.... or you apply methods of dimensionality reduction such as PCA.
Whether or not to do so and how to do so is another topic.
Then, plotting is easy and is done as here:
http://matplotlib.org/api/pyplot_api.html
I provide an example code for this solution:
import matplotlib.pyplot as plt
import numpy as np

#fake example data
song1 = np.asarray([1, 2, 3, 4, 5, 6, 2, 35, 4, 1])
song2 = song1*2
song3 = song1*1.5

#list of arrays containing all data
data = [song1, song2, song3]

#calculate 2d indicators
def indic(data):
    #alternatively you can calulate any other indicators
    max = np.max(data, axis=1)
    min = np.min(data, axis=1)
    return max, min

x,y = indic(data)
plt.scatter(x, y, marker='x')
plt.show()
The results looks like this:
![enter image description here]()
Yet i want to suggest another solution to your underlying problem, namely: plotting multidimensional data.
I recommend using something parralel coordinate plot which can be constructed with the same fake data:
import pandas as pd
pd.DataFrame(data).T.plot()
plt.show()
Then the result shows all coefficents for each song along the x axis and their value along the y axis. I would looks as follows:
![enter image description here]()
UPDATE:
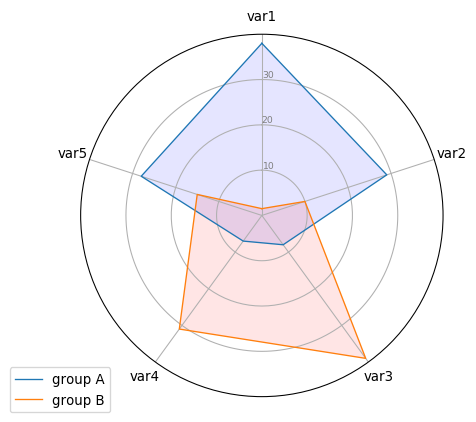
In the meantime I have discovered the Python Image Gallery which contains two nice example of high dimensional visualization with reference code:
![enter image description here]()
![enter image description here]()


