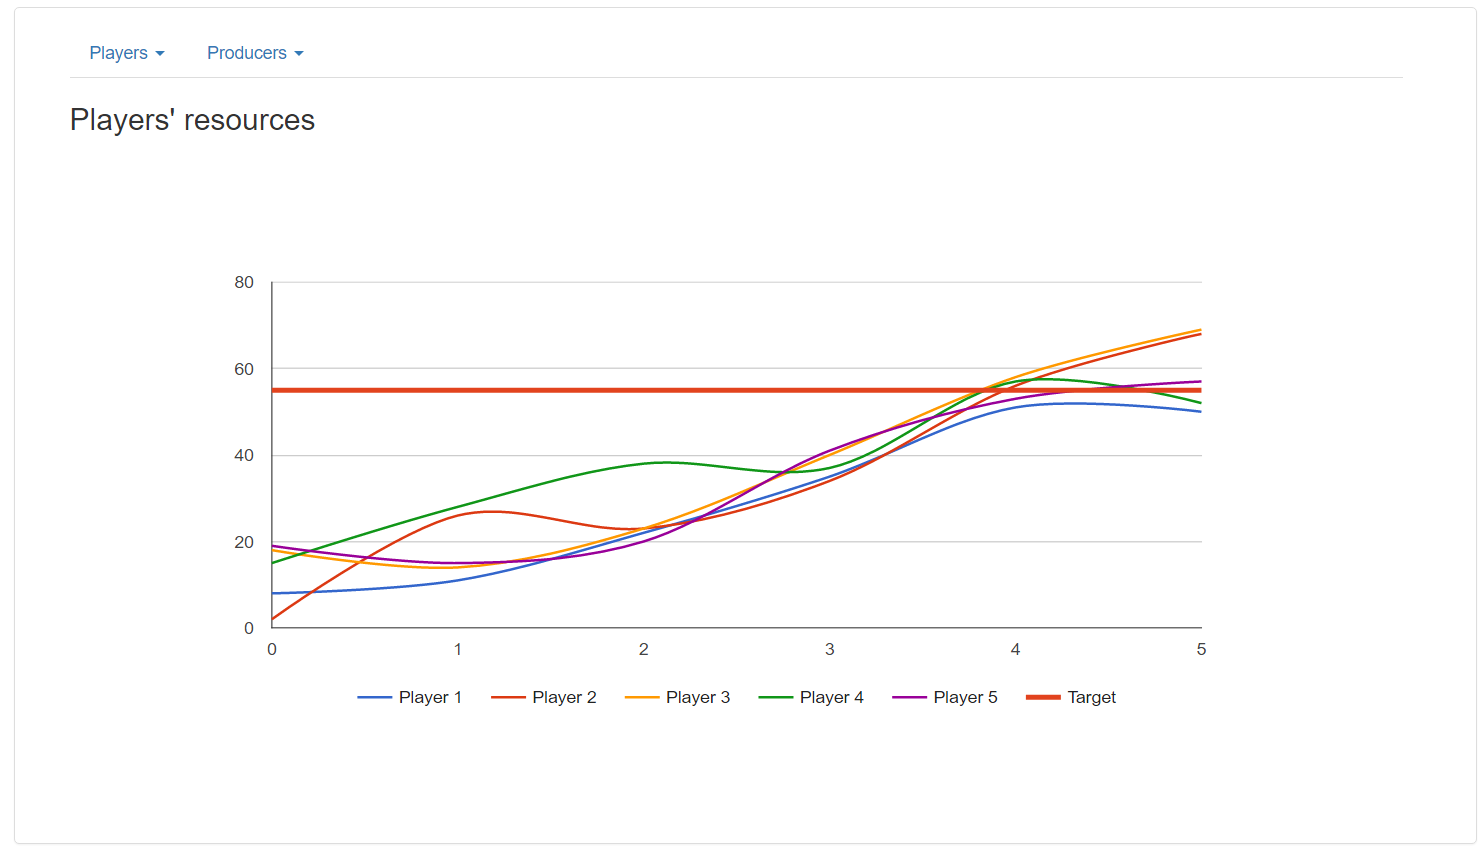
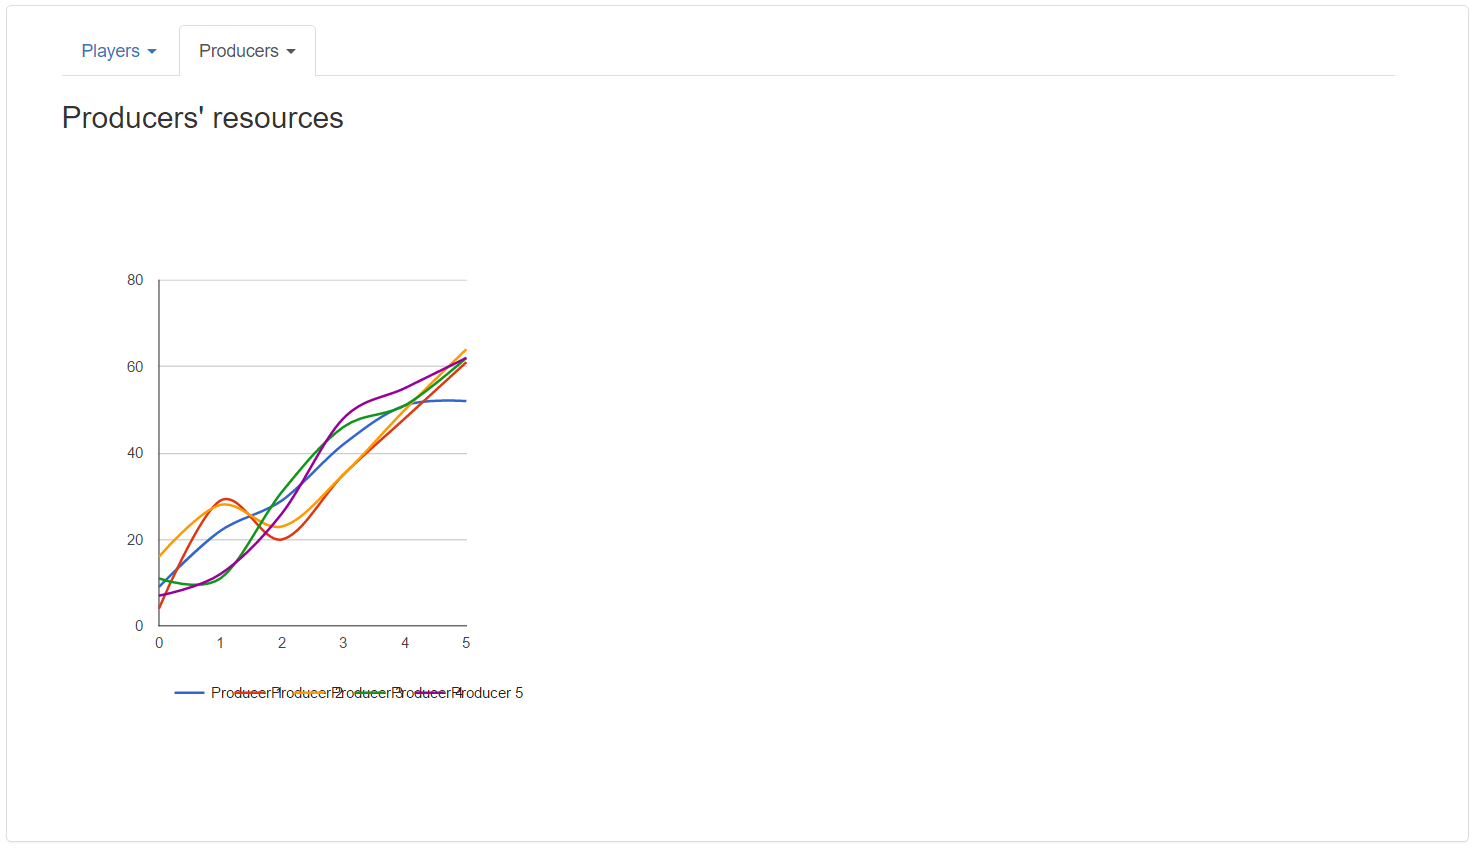
I have an issue with displaying a Google Chart in a Boostrap tab. I have two tabs, and a Google Chart in each. In the first one, the chart is correctly displayed, but in the second one, the chart is tiny and compressed. I don't understand why..
Here is my code :
<div class="tab-pane active" id="player">
    <h3>Players' resources</h3>
    <div id="totalPlayerChart" style="height: 500px;"></div>
</div>

<div class="tab-pane" id="producer">
    <h3>Producers' resources</h3>
    <div id="totalProducerChart" style="height: 500px;"></div>
</div>

<script type="text/javascript">
    google.charts.load('current', {'packages':['corechart']});
    google.charts.setOnLoadCallback(drawTotalPlayerChart);
    google.charts.setOnLoadCallback(drawTotalProducerChart);

    function drawTotalPlayerChart() {
        [...]
        var chart = new google.visualization.LineChart(document.getElementById('totalPlayerChart'));
        chart.draw(data, options);
    }

    function drawTotalProducerChart() {
        [...]
        var chart = new google.visualization.LineChart(document.getElementById('totalProducerChart'));
        chart.draw(data, options);
    }
</script>


