How to label data points in matplotlib scatter plot while looping through pandas dataframes?
Asked Answered
A

3

2

I have a pandas dataframe including the following columns:

label = ('A' , 'D' , 'K', 'L', 'P')
x = (1 , 4 , 9, 6, 4)
y = (2 , 6 , 5, 8, 9)
plot_id = (1 , 1 , 2, 2, 3)

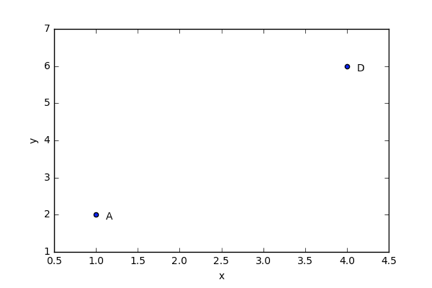
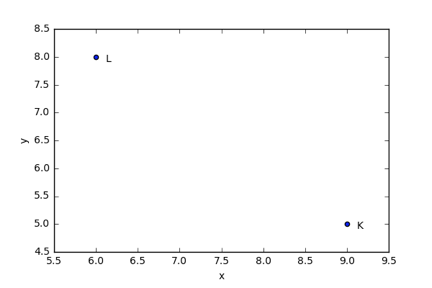
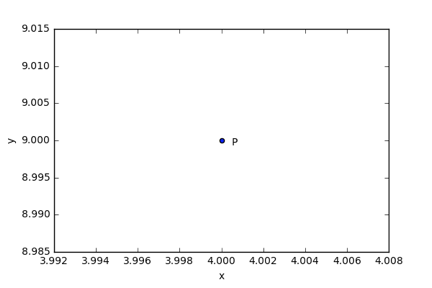
I want to creat 3 seperate scatter plots - one for each individual plot_id. So the first scatter plot should consists all entries where plot_id == 1 and hence the points (1,2) and (4,6). Each data point should be labelled by label. Hence the first plot should have the labels Aand B.

I understand I can use annotate to label, and I am familiar with for loops. But I have no idea how to combine the two.

I wish I could post better code snippet of what I have done so far - but it's just terrible. Here it is:

for i in range(len(df.plot_id)):
    plt.scatter(df.x[i],df.y[i])
    plt.show()

That's all I got - unfortunately. Any ideas on how to procede?

Aqueous answered 5/12, 2016 at 16:38 Comment(9)
what is the link between plot_id and label ?Expectoration
Sorry, I edited the question while commented. I basically am trying to make 3 plots - for each individual plot_id.Aqueous
then label column is useless ...Expectoration
No. I want to label/annotate the data entries (or glyphs if you will) with label.Aqueous
You need to be very precise about the following: How many plots do you want to create? How many points do you want each plot to have? Where should the labels appear in the plot? Is it correct that you want to have exactly one point per plot?Fatally
Sorry. I edited the question above. Do I make myself understandable?Aqueous
how many different plot_ids do you have ? If it's a small number you can do some subplots.Expectoration
I have 54. how would that work?Aqueous
Updated my answer.Saad
S
4

updated answer
save separate image files

def annotate(row, ax):
    ax.annotate(row.label, (row.x, row.y),
                xytext=(10, -5), textcoords='offset points')

for pid, grp in df.groupby('plot_id'):
    ax = grp.plot.scatter('x', 'y')
    grp.apply(annotate, ax=ax, axis=1)
    plt.savefig('{}.png'.format(pid))
    plt.close()

1.png
enter image description here

2.png
enter image description here

3.png
enter image description here

old answer
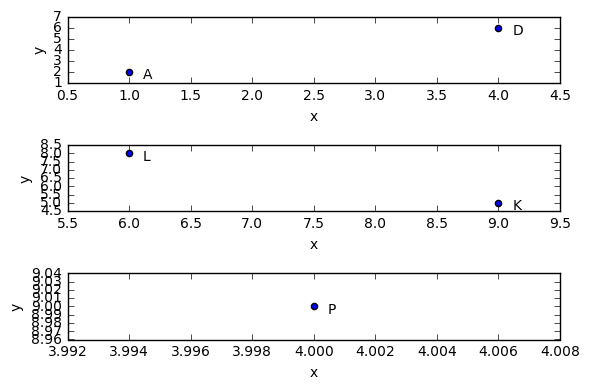
for those who want something like this

def annotate(row, ax):
    ax.annotate(row.label, (row.x, row.y),
                xytext=(10, -5), textcoords='offset points')

fig, axes = plt.subplots(df.plot_id.nunique(), 1)
for i, (pid, grp) in enumerate(df.groupby('plot_id')):
    ax = axes[i]
    grp.plot.scatter('x', 'y', ax=ax)
    grp.apply(annotate, ax=ax, axis=1)
fig.tight_layout()

enter image description here

setup

label = ('A' , 'D' , 'K', 'L', 'P')
x = (1 , 4 , 9, 6, 4)
y = (2 , 6 , 5, 8, 9)
plot_id = (1 , 1 , 2, 2, 3)

df = pd.DataFrame(dict(label=label, x=x, y=y, plot_id=plot_id))
Saad answered 5/12, 2016 at 17:13 Comment(4)
since there are 54 plot_ids, I don't think subplots might be a good idea. am I wrong ?Expectoration
I'm sorry, you weren't clear. You said you wanted separate plots.Saad
Yes, indeed. I need 54 individual plots. I will try to be more clear next time!Aqueous
Great solution! Thank you!Aqueous
E
1

Here is a simple way to deal with your problem :

zipped = zip(zip(zip(df.x, df.y), df.plot_id), df.label)
# Result : [(((1, 2), 1), 'A'),
#           (((4, 6), 1), 'D'),
#           (((9, 5), 2), 'K'),
#           (((6, 8), 2), 'L'),
#           (((4, 9), 3), 'P')]

To retrieve the positions, the plot index and the labels, you can loop as below :

for (pos, plot), label in zipped:
    ...
    print pos
    print plot
    print label

Now here is what you can do in your case :

import matplotlib.pyplot as plt

for (pos, plot), label in zipped:
    plt.figure(plot)
    x, y = pos
    plt.scatter(x, y)
    plt.annotate(label, xy=pos)

It will create as much figures as plot_ids and for each figure display the scatter plot of the points with the corresponding plot_ids value. What's more it overlays the label on each point.

Expectoration answered 5/12, 2016 at 17:14 Comment(6)
Wow! This is great! Is there a way to save the plots on the loop too? I tried to adapt the code and save but unfortunately replace too...Aqueous
I get a figure for each pos . So given the example brought forward, I get 6 figures. How do I combine them into 3?Aqueous
@Aqueous Are you sure that you get a figure for each pos ? It works perfectly for me ...Expectoration
Yes. Your print command suggests you use Python 2 whilst I use python 3? Maybe that's why?Aqueous
can you edit your question with your new piece of code and the variables you use ? I'll check it outExpectoration
I copied your code exactly (I always do, before applying it to my own code). I do indeed get a figure for each pos. Strange! Any ideas?Aqueous
S
0

This is a function to create these plots (based on @piRSquared answer)

def plotter2(data,x,y,grp,lbl):

    def annotate(row, ax):
       ax.annotate(row[lbl], (row[x], row[y]),
            xytext=(3, 0), textcoords='offset points')

   for pid, grp in data.groupby(grp):
       ax = grp.plot.scatter(x, y)
       grp.apply(annotate, ax=ax, axis=1)
       plt.show()
       plt.savefig('{}.png'.format(pid))
Synovitis answered 7/9, 2022 at 16:58 Comment(0)

© 2022 - 2024 — McMap. All rights reserved.