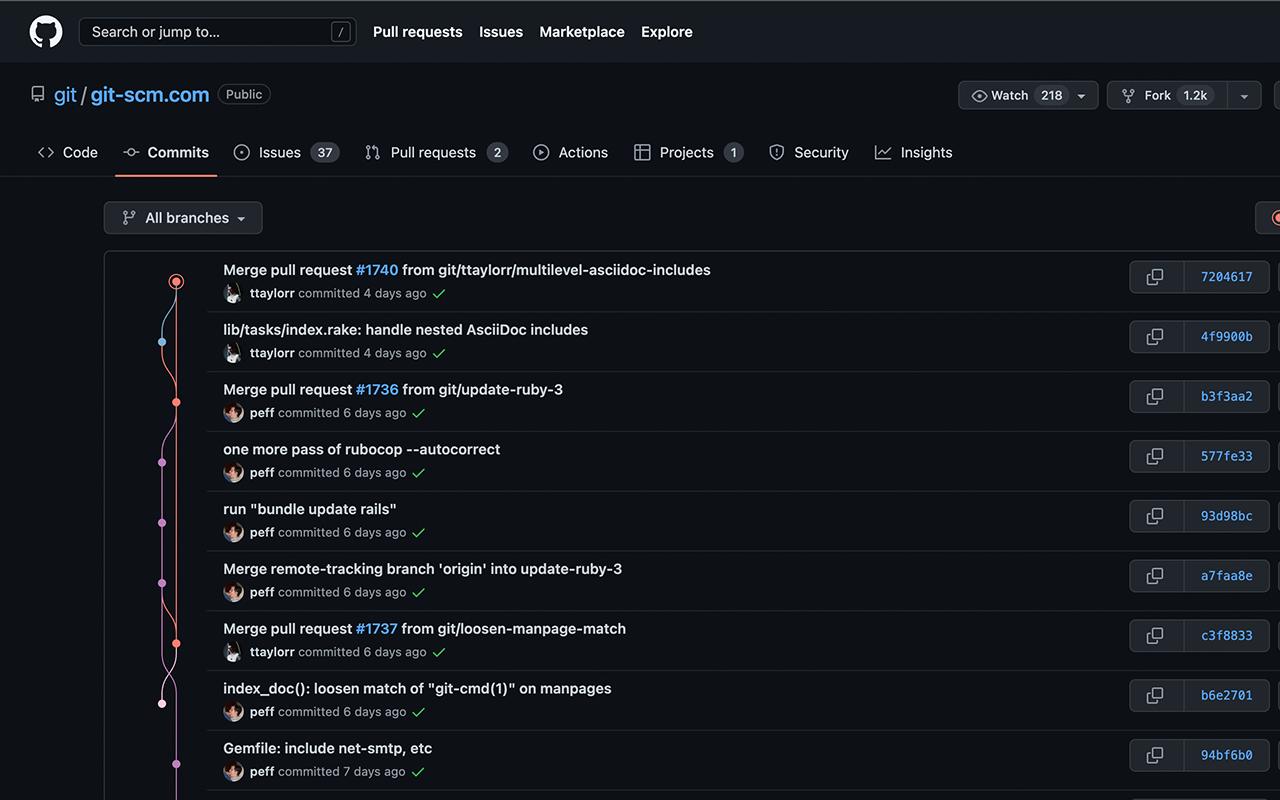
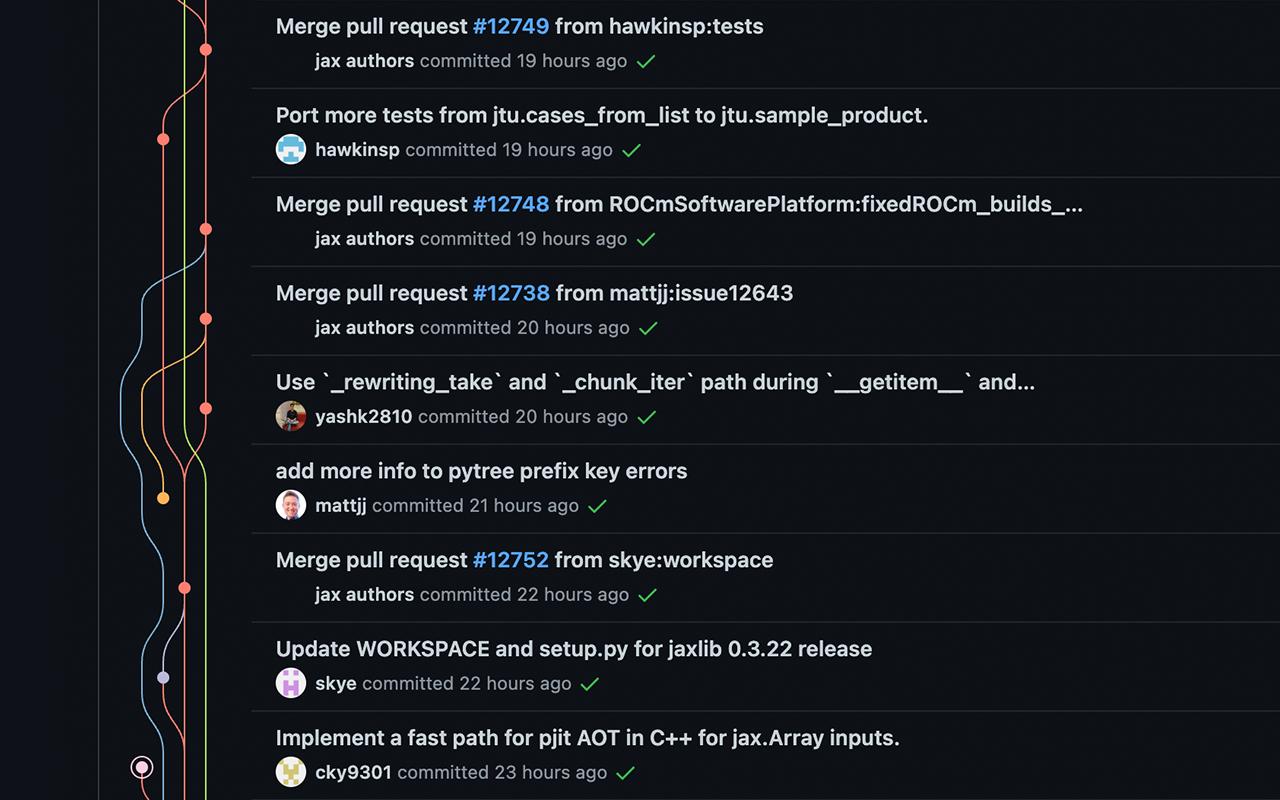
Every time I was thinking of switching all of our little team's projects to git / github, what pained me was that there didn't seem to be a tool to visualize all this social coding goodness.
When we all start wildly branching, forking and merging, I feel we're going to need a tool that would let us graphically see the full picture of our repository and its multitude of branches, in order to come up with a plan to merge it all back at some point into one and only truth (the proverbial origin/master).
I've tried googling for such a visualization tool on several occasions, but came up empty handed. Was hoping that GitHub for Windows would solve this once and for all, but all it shows is linear history for a particular checked out branch.
What I'm looking for is something akin to what TortoiseHg has - a graph showing all branches and commits. Are you aware of any such tools? (We're on Windows.)


