Plotting vectors in a coordinate system with R or python
Asked Answered
S

5

14

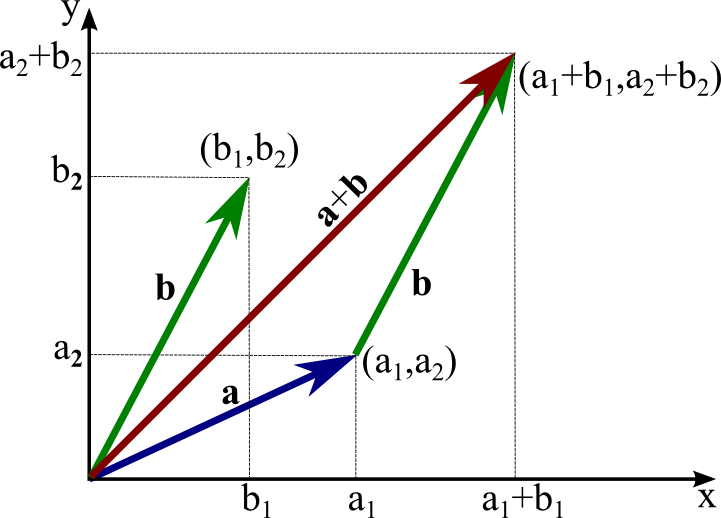
I am looking for advice on plotting vectors in the cartesian plane. The task is to plot points (coordinates) and then to link them with an arrow to some source point (say 0,0). The image below should give an idea. I don't care about colours and naming vectors/points, it's just about plotting arrows in the coordinate plane. I am sure some library exists in R (or python) for plotting linear algebra vectors and operations.

Any pointers would be appreciated!

vectors in a plane
(source: mathinsight.org)

Straka answered 4/6, 2012 at 13:39 Comment(1)
"any pointers would be appreciated" groanTalky
C
16

Or you can use arrows function in R.

plot(c(0,1),c(0,1))
arrows(0,0,1,1)
Cordelia answered 4/6, 2012 at 13:51 Comment(3)
Interesting. Would it be possible to add some eye-candy to the arrow? (thickness, color, arrowhead-style, dash...)Viradis
@Viradis See ?arrows. It says col, lty and lwd are accepted.Dehumanize
Also, if you want to be fancy in your labels, check out the tikzDevice package.Dehumanize
P
14
plot(NA, xlim=c(0,5), ylim=c(0,5), xlab="X", ylab="Y")
vecs <- data.frame(vname=c("a","b","a+b", "transb"), 
                   x0=c(0,0,0,2),y0=c(0,0,0,1), x1=c(2,1,3,3) ,y1=c(1,2,3,3), 
                   col=1:4)
with( vecs, mapply("arrows", x0, y0, x1,y1,col=col) )

It will look a bit better if you add lwd=3 to the arrows call. The text function would allow labeling and can be rotated with the 'srt' parameter.

plot(NA, xlim=c(0,5), ylim=c(0,5), xlab="X", ylab="Y", lwd=3)
 with( vecs, mapply("arrows", x0, y0, x1,y1,col=col,lwd=3) )
 with(vecs, mapply('text', x=x1[1:3]-.1, y=y1[1:3]+.1, 
  labels=expression(list(a[1],a[2]), list(b[1],b[2]), list(a[1]+b[1],a[2]+b[2]) ) ))

enter image description here

PLease note that the list function inside the expression call is a plotmath list-call, different than the regular R list just as plotmath-paste is different than regular paste. It does not make any attempt to evaluate its argument in the parent-frame. For that one would need bquote or substitute and would probably need to use sapply be used to process the "interior" expressions.
Pounce answered 4/6, 2012 at 16:30 Comment(1)
I figured adding the expression vector method of labeling would be useful. Check out ?plotmath where you should learn that the plotmath list function is not the same as the R list function. That is also true of the plotmath paste function vis-a-vis the main paste function. The plotmath list changes commas inside expressions to literal commas as opposed to syntactic operations.Pounce
M
3

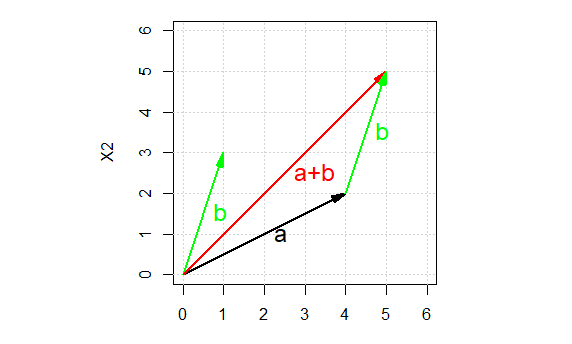
Check out the matlib package.

library(matlib)
#setting up the plot
xlim <- c(0,6)
ylim <- c(0,6)
par(mar=c(3,3,1,1)+.1)
plot(xlim, ylim, type="n", xlab="X1", ylab="X2", asp=1)
grid()
# define some vectors
a=c(4,2)
b=c(1,3)
# plot the vectors
vectors(b, labels="b", pos.lab=4, frac.lab=.5, col="green")
vectors(a, labels="a", pos.lab=4, frac.lab=.5)
vectors(a+b, labels="a+b", pos.lab=4, frac.lab=.5, col="red")
# vector a+b starting from a is equal to b.
vectors(a+b, labels="b", pos.lab=4, frac.lab=.5, origin=a, col="green")

result

Melano answered 14/8, 2020 at 8:56 Comment(0)
H
2

An Easy(TM) way to draw a few random magnitude 2 vectors. I first calculate the euclidean norm, else the arrow function will plot arrows from point to point creating a triangle, nice as an explanation, but not what we want. The rest is straightforward:

#first some vectors 
v1<-c(-3,5)
v2<-c(2,-10)
v3 <-c(0,-3)
v4 <- c(2,5)
# This one for the coordinates of the plot
ax<-c(-10,10)
# I will need the euclidean norm (two-norm) of the vectors: 
mag <- function(x) sqrt(sum(x^2))
# I call plot to set up the "canvas"
plot(ax,ax,main="Test")
# I do the stuffz, the FIRST pair of params is the ORIGIN
arrows(0,0, mag(v1),mag(v2),lwd=4,col="red")
arrows(-2,1, mag(v3),mag(v4),lwd=4,col="blue")
Help answered 29/1, 2015 at 16:30 Comment(0)
V
0

The most obvious course of action would be to use python's matplotlib package, which has a lot of plotting features.

Specifically, you'd like to reverse-engineer this example.

Another way to get nice results, in a more artistic and less cartesian way, would be to create and render SVG using rsvg. I have never tried that, but SVG should have native support for arrow-heads. Also, SVG files can be edited in drawing programs like Inkscape if needed.

Viradis answered 4/6, 2012 at 13:51 Comment(0)

© 2022 - 2024 — McMap. All rights reserved.