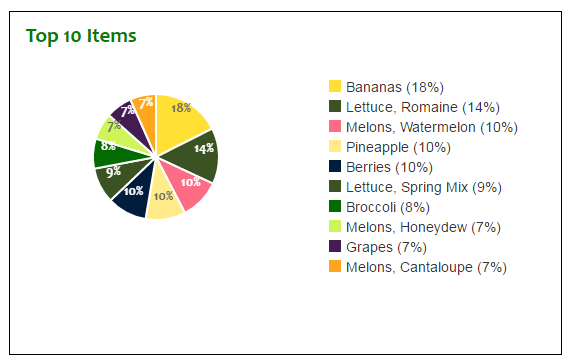
I'm generating a pie chart with legend that looks like so:
As you can perceive, the pie is pitifully puny. I prefer it to be twice as tall and twice as wide.
Here is the code I am using:
    var formatter = new Intl.NumberFormat("en-US");

    Chart.pluginService.register({
        afterDatasetsDraw: function (chartInstance) {
            var ctx = chartInstance.chart.ctx;

            ctx.font = Chart.helpers.fontString(14, 'bold', Chart.defaults.global.defaultFontFamily);
            ctx.textAlign = 'center';
            ctx.textBaseline = 'bottom';
            ctx.fillStyle = '#666';

            chartInstance.config.data.datasets.forEach(function (dataset) {

                for (var i = 0; i < dataset.data.length; i++) {
                    var model = dataset._meta[Object.keys(dataset._meta)[0]].data[i]._model,
                        total = dataset._meta[Object.keys(dataset._meta)[0]].total,
                        mid_radius = model.innerRadius + (model.outerRadius - model.innerRadius) / 2,
                        start_angle = model.startAngle,
                        end_angle = model.endAngle,
                        mid_angle = start_angle + (end_angle - start_angle) / 2;

                    var x = mid_radius * 1.5 * Math.cos(mid_angle);
                    var y = mid_radius * 1.5 * Math.sin(mid_angle);

                    ctx.fillStyle = '#fff';
                    if (i === 0 || i === 3 || i === 7) { // Darker text color for lighter background
                        ctx.fillStyle = '#666';
                    }
                    var percent = String(Math.round(dataset.data[i] / total * 100)) + "%";
                    // this prints the data number
                    // this prints the percentage
                    ctx.fillText(percent, model.x + x, model.y + y);
                }
            });
        }
    });

    var data = {
        labels: [
            "Bananas (18%)",
            "Lettuce, Romaine (14%)",
            "Melons, Watermelon (10%)",
            "Pineapple (10%)",
            "Berries (10%)",
            "Lettuce, Spring Mix (9%)",
            "Broccoli (8%)",
            "Melons, Honeydew (7%)",
            "Grapes (7%)",
            "Melons, Cantaloupe (7%)"
        ],
        datasets: [
        {
            data: [2755, 2256, 1637, 1608, 1603, 1433, 1207, 1076, 1056, 1048],
            backgroundColor: [
                "#FFE135",
                "#3B5323",
                "#fc6c85",
                "#ffec89",
                "#021c3d",
                "#3B5323",
                "#046b00",
                "#cef45a",
                "#421C52",
                "#FEA620"
                  ]
        }]
    };

    var optionsPie = {
        responsive: true,
        scaleBeginAtZero: true,
        legend: {
            display: false
        },
        tooltips: {
            callbacks: {
                label: function (tooltipItem, data) {
                    return data.labels[tooltipItem.index] + ": " +
                        formatter.format(data.datasets[tooltipItem.datasetIndex].data[tooltipItem.index]);
                }
            }
        }
    };

    var ctx = $("#top10ItemsChart").get(0).getContext("2d");
    var top10PieChart = new Chart(ctx,
    {
        type: 'pie',
        data: data,
        options: optionsPie,
        animation: {
            duration: 0,
            easing: "easeOutQuart",
            onComplete: function () {
                var ctx = this.chart.ctx;
                ctx.font = Chart.helpers.fontString(Chart.defaults.global.defaultFontFamily, 'normal', Chart.defaults.global.defaultFontFamily);
                ctx.textAlign = 'center';
                ctx.textBaseline = 'bottom';

                this.data.datasets.forEach(function (dataset) {

                    for (var i = 0; i < dataset.data.length; i++) {
                        var model = dataset._meta[Object.keys(dataset._meta)[0]].data[i]._model,
                        total = dataset._meta[Object.keys(dataset._meta)[0]].total,
                        mid_radius = model.innerRadius + (model.outerRadius - model.innerRadius) / 2,
                        start_angle = model.startAngle,
                        end_angle = model.endAngle,
                        mid_angle = start_angle + (end_angle - start_angle) / 2;

                        var x = mid_radius * Math.cos(mid_angle);
                        var y = mid_radius * Math.sin(mid_angle);

                        ctx.fillStyle = '#fff';
                        if (i === 3) { // Darker text color for lighter background
                            ctx.fillStyle = '#444';
                    }
                    var percent = String(Math.round(dataset.data[i] / total * 100)) + "%";
                    // this prints the data number
                    ctx.fillText(dataset.data[i], model.x + x, model.y + y);
                    // this prints the percentage
                    ctx.fillText(percent, model.x + x, model.y + y + 15);
                }
            });
        }
    }
});

    $("#top10Legend").html(top10PieChart.generateLegend());
How can I increase the size of the pie?
UPDATE
The "View" as requested by Nkosi is:
<div class="row" id="top10Items">
    <div class="col-md-6">
        <div class="topleft">
            <h2 class="sectiontext">Top 10 Items</h2>
            <br />
            <div id="piechartlegendleft">
                <div id="container">
                    <canvas id="top10ItemsChart"></canvas>
                </div>
                <div id="top10Legend" class="pieLegend"></div>
            </div>
        </div>
    </div>
    . . .
The classes "row" and "col-md-6" are Bootstrap classes.
The custom classes are "topleft":
.topleft {
    margin-top: -4px;
    margin-left: 16px;
    margin-bottom: 16px;
    padding: 16px;
    border: 1px solid black;
}
...sectionText:
.sectiontext {
    font-size: 1.5em;
    font-weight: bold;
    font-family: Candara, Calibri, Cambria, serif;
    color: green;
    margin-top: -4px;
}
...and "pieLegend":
.pieLegend li span {
    display: inline-block;
    width: 12px;
    height: 12px;
    margin-right: 5px;
}

