Multi-color Legend Entry
Asked Answered
T

6

16

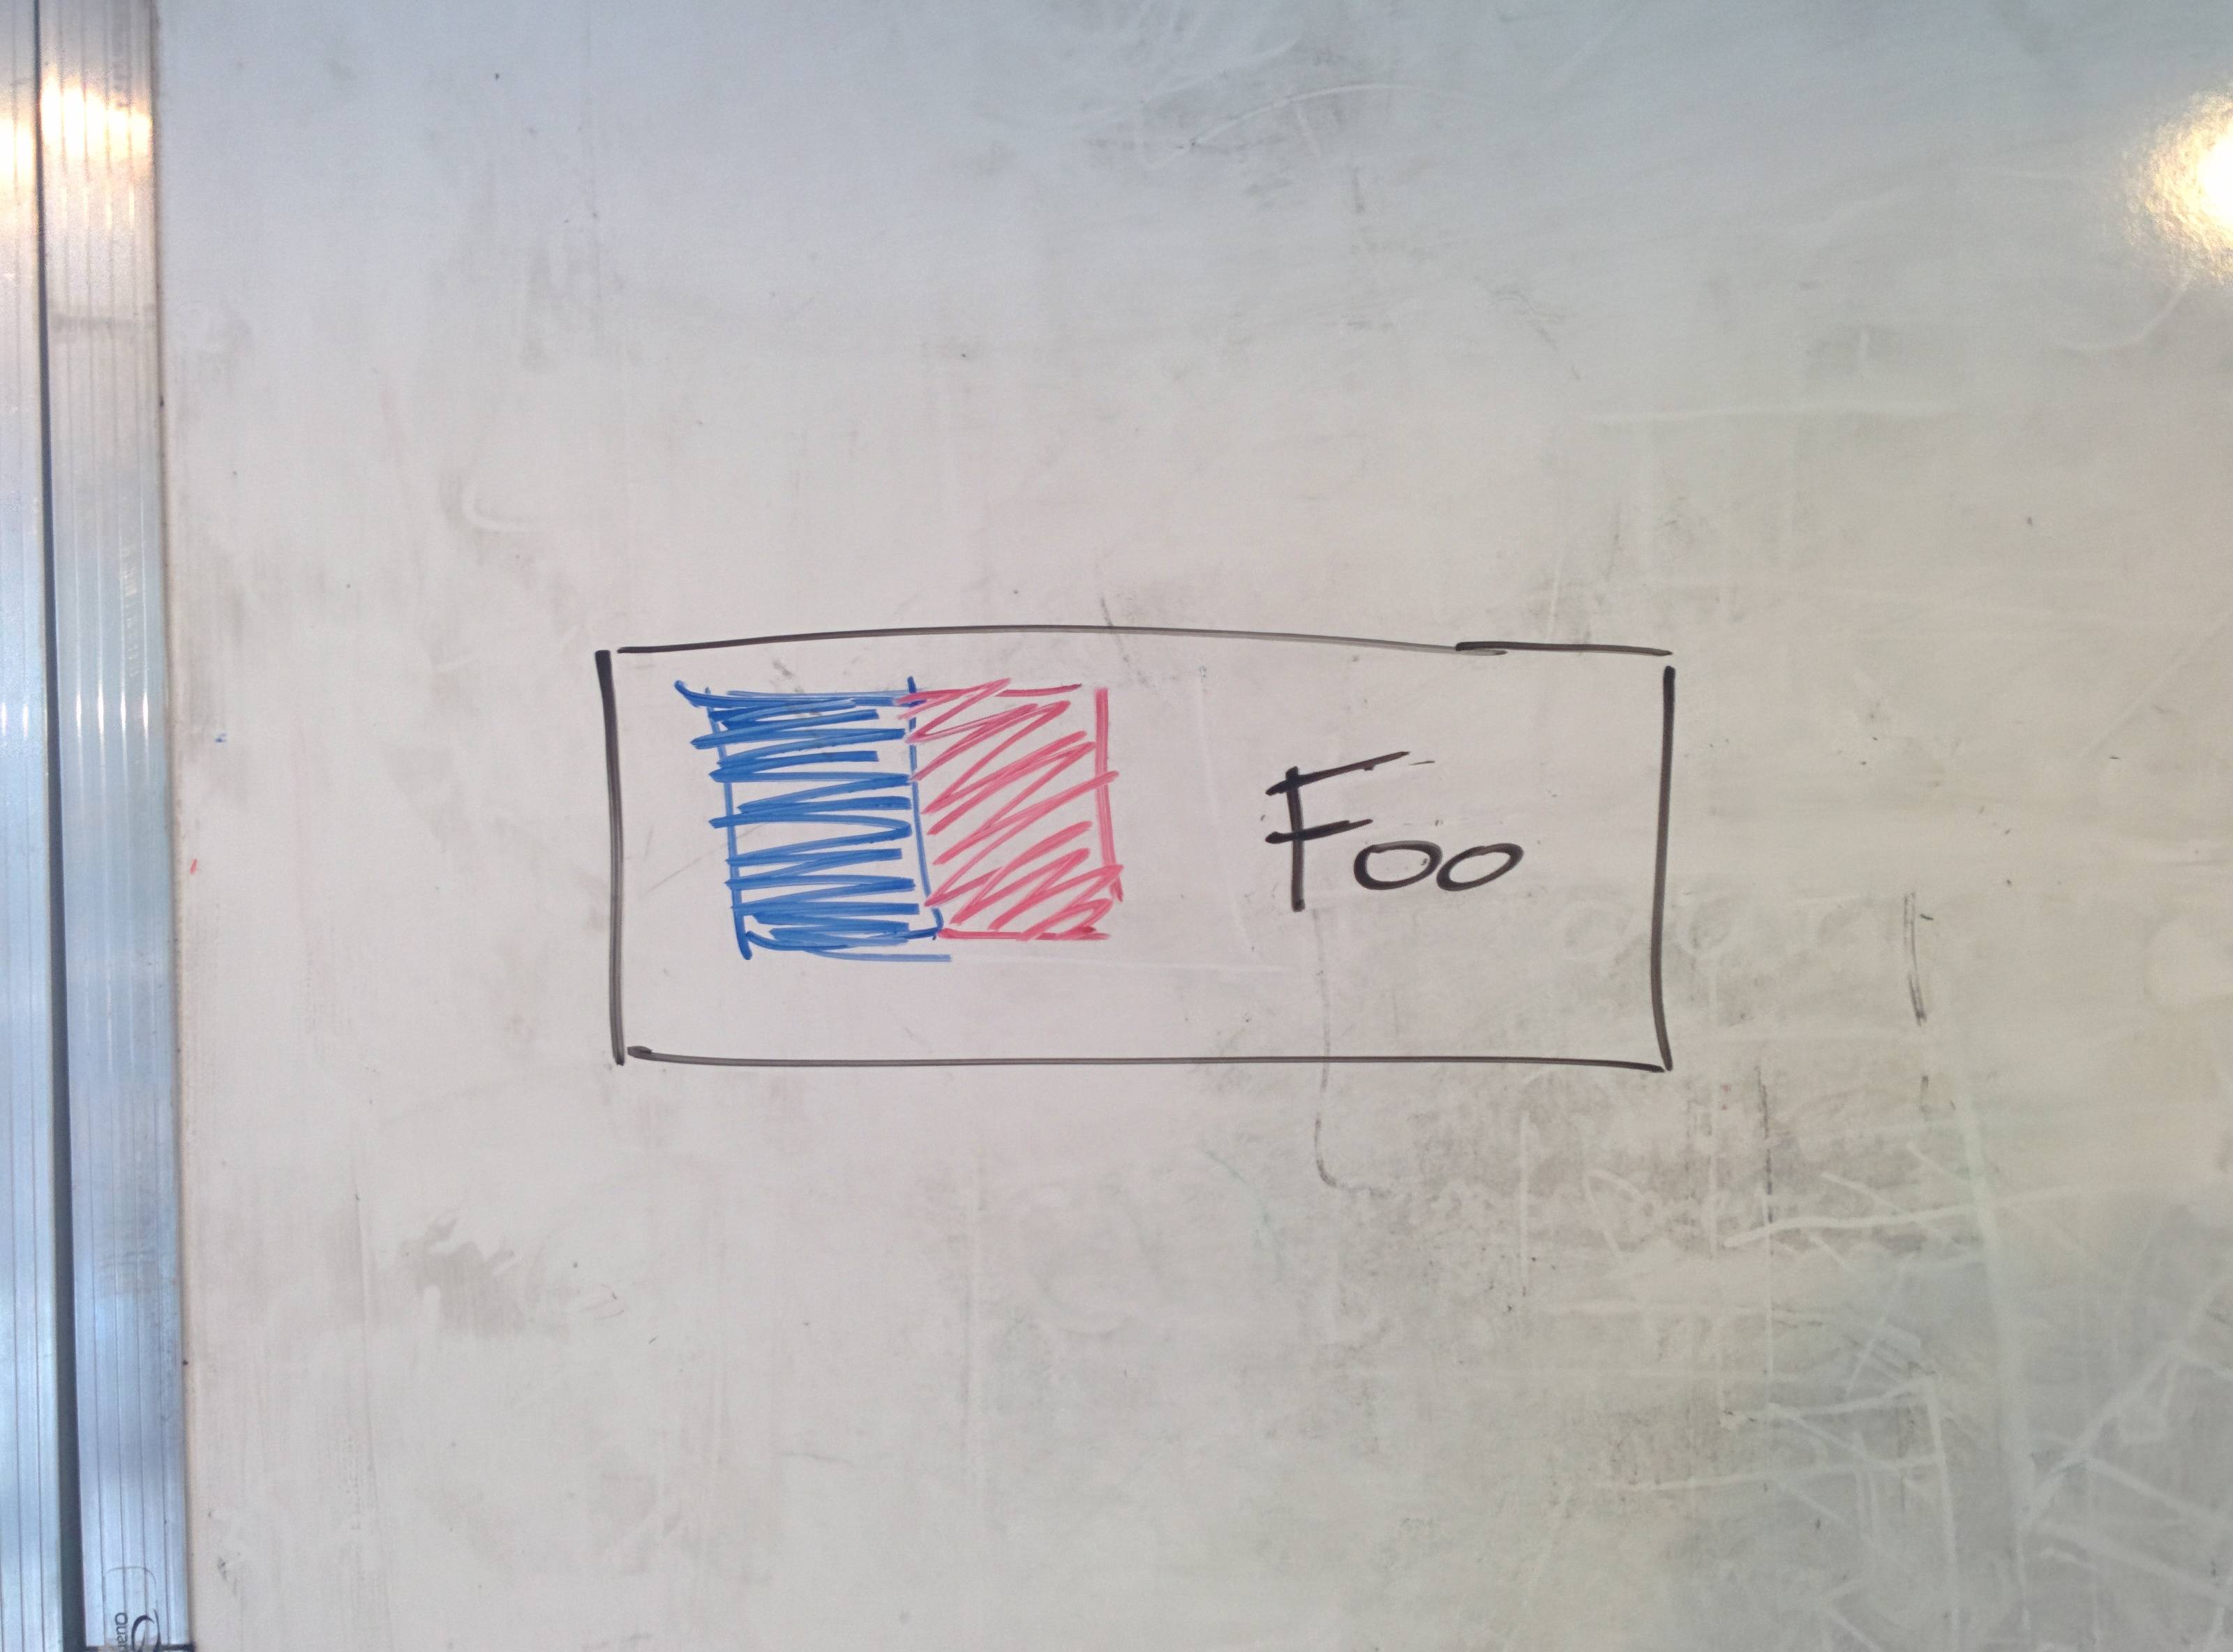
I would like to make a legend entry in a matplotlib look something like this:

enter image description here

It has multiple colors for a given legend item. Code is shown below which outputs a red rectangle. I'm wondering what I need to do to overlay one color ontop of another? Or is there a better solution?

import matplotlib.patches as mpatches
import matplotlib.pyplot as plt

red_patch = mpatches.Patch(color='red', label='Foo')
plt.legend(handles=[red_patch])

plt.show()
Temple answered 9/8, 2015 at 21:23 Comment(1)
#57789691Yetta
S
9

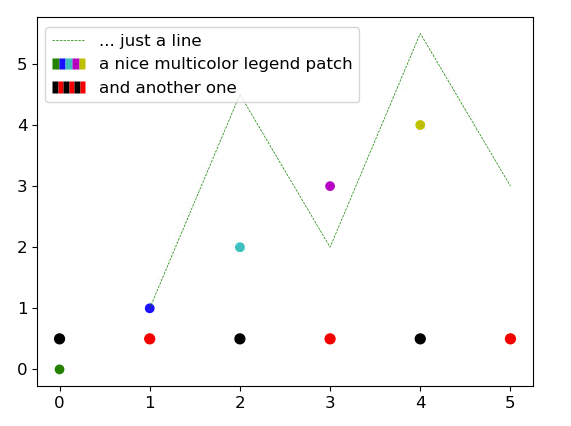
There is in fact a proper way to do this by implementing a custom legend handler as explained in the matplotlib-doc under "implementing a custom legend handler" (here):

import matplotlib.pyplot as plt
from matplotlib.collections import PatchCollection

# define an object that will be used by the legend
class MulticolorPatch(object):
    def __init__(self, colors):
        self.colors = colors
        
# define a handler for the MulticolorPatch object
class MulticolorPatchHandler(object):
    def legend_artist(self, legend, orig_handle, fontsize, handlebox):
        width, height = handlebox.width, handlebox.height
        patches = []
        for i, c in enumerate(orig_handle.colors):
            patches.append(plt.Rectangle([width/len(orig_handle.colors) * i - handlebox.xdescent, 
                                          -handlebox.ydescent],
                           width / len(orig_handle.colors),
                           height, 
                           facecolor=c, 
                           edgecolor='none'))

        patch = PatchCollection(patches,match_original=True)

        handlebox.add_artist(patch)
        return patch


# ------ choose some colors
colors1 = ['g', 'b', 'c', 'm', 'y']
colors2 = ['k', 'r', 'k', 'r', 'k', 'r']

# ------ create a dummy-plot (just to show that it works)
f, ax = plt.subplots()
ax.plot([1,2,3,4,5], [1,4.5,2,5.5,3], c='g', lw=0.5, ls='--',
        label='... just a line')
ax.scatter(range(len(colors1)), range(len(colors1)), c=colors1)
ax.scatter([range(len(colors2))], [.5]*len(colors2), c=colors2, s=50)

# ------ get the legend-entries that are already attached to the axis
h, l = ax.get_legend_handles_labels()

# ------ append the multicolor legend patches
h.append(MulticolorPatch(colors1))
l.append("a nice multicolor legend patch")

h.append(MulticolorPatch(colors2))
l.append("and another one")

# ------ create the legend
f.legend(h, l, loc='upper left', 
         handler_map={MulticolorPatch: MulticolorPatchHandler()}, 
         bbox_to_anchor=(.125,.875))

enter image description here

System answered 7/6, 2021 at 11:36 Comment(0)
R
6

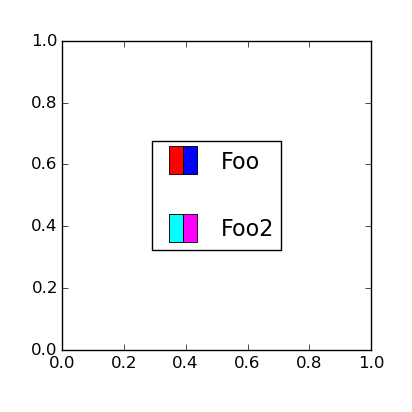
The solution I am proposing is to combine two different proxy-artists for one entry legend, as described here: Combine two Pyplot patches for legend.

The strategy is then to set the fillstyle of the first square marker to left while the other one is set to right (see http://matplotlib.org/1.3.0/examples/pylab_examples/filledmarker_demo.html). Two different colours can then be attributed to each marker in order to produce the desired two-colour legend entry.

The code below show how this can be done. Note that the numpoints=1 argument in plt.legend is important in order to display only one marker for each entry.

import matplotlib.pyplot as plt

plt.close('all')

#---- Generate a Figure ----

fig = plt.figure(figsize=(4, 4))
ax = fig.add_axes([0.15, 0.15, 0.75, 0.75])
ax.axis([0, 1, 0, 1])

#---- Define First Legend Entry ----

m1, = ax.plot([], [], c='red' , marker='s', markersize=20,
              fillstyle='left', linestyle='none')

m2, = ax.plot([], [], c='blue' , marker='s', markersize=20,
              fillstyle='right', linestyle='none')

#---- Define Second Legend Entry ----

m3, = ax.plot([], [], c='cyan' , marker='s', markersize=20,
              fillstyle='left', linestyle='none')

m4, = ax.plot([], [], c='magenta' , marker='s', markersize=20,
              fillstyle='right', linestyle='none')

#---- Plot Legend ----

ax.legend(((m2, m1), (m3, m4)), ('Foo', 'Foo2'), numpoints=1, labelspacing=2,
          loc='center', fontsize=16)

plt.show(block=False)

Which results in:

enter image description here

Disclaimer: This will only work for a two-colors legend entry. If more than two colours is desired, I cannot think of any other way to do this other than the approach described by @jwinterm (Python Matplotlib Multi-color Legend Entry)

Roundtree answered 10/8, 2015 at 2:43 Comment(0)
B
6

Perhaps another hack to handle more than two patches. Make sure you order the handles/labels according to the number of columns:

from matplotlib.patches import Patch
import matplotlib.pyplot as plt

fig, ax = plt.subplots()

pa1 = Patch(facecolor='red', edgecolor='black')
pa2 = Patch(facecolor='blue', edgecolor='black')
pa3 = Patch(facecolor='green', edgecolor='black')
#
pb1 = Patch(facecolor='pink', edgecolor='black')
pb2 = Patch(facecolor='orange', edgecolor='black')
pb3 = Patch(facecolor='purple', edgecolor='black')

ax.legend(handles=[pa1, pb1, pa2, pb2, pa3, pb3],
          labels=['', '', '', '', 'First', 'Second'],
          ncol=3, handletextpad=0.5, handlelength=1.0, columnspacing=-0.5,
          loc='center', fontsize=16)

plt.show()

which results in:

Berliner answered 4/9, 2020 at 12:58 Comment(2)
By far, this is the easiest to apply.Ozmo
A hack, but it works!Perce
J
5

I absolutely loved @raphael's answer. Here is a version with circles. Furthermore, I've refactored and trimmed the code a bit to make it more modular.

import matplotlib.pyplot as plt
import matplotlib.colors as mcolors

class MulticolorCircles:
    """
    For different shapes, override the ``get_patch`` method, and add the new
    class to the handler map, e.g. via

    ax_r.legend(ax_r_handles, ax_r_labels, handlelength=CONF.LEGEND_ICON_SIZE,
            borderpad=1.2, labelspacing=1.2,
            handler_map={MulticolorCircles: MulticolorHandler})
    """

    def __init__(self, face_colors, edge_colors=None, face_alpha=1,
                 radius_factor=1):
        """
        """
        assert 0 <= face_alpha <= 1, f"Invalid face_alpha: {face_alpha}"
        assert radius_factor > 0, "radius_factor must be positive"
        self.rad_factor = radius_factor
        self.fc = [mcolors.colorConverter.to_rgba(fc, alpha=face_alpha)
                   for fc in face_colors]
        self.ec = edge_colors
        if edge_colors is None:
            self.ec = ["none" for _ in self.fc]
        self.N = len(self.fc)

    def get_patch(self, width, height, idx, fc, ec):
        """
        """
        w_chunk = width / self.N
        radius = min(w_chunk / 2, height) * self.rad_factor
        xy = (w_chunk * idx + radius, radius)
        patch = plt.Circle(xy, radius, facecolor=fc, edgecolor=ec)
        return patch

    def __call__(self, width, height):
        """
        """
        patches = []
        for i, (fc, ec) in enumerate(zip(self.fc, self.ec)):
            patch = self.get_patch(width, height, i, fc, ec)
            patches.append(patch)
        result = PatchCollection(patches, match_original=True)
        #
        return result


class MulticolorHandler:
    """
    """
    @staticmethod
    def legend_artist(legend, orig_handle, fontsize, handlebox):
        """
        """
        width, height = handlebox.width, handlebox.height
        patch = orig_handle(width, height)
        handlebox.add_artist(patch)
        return patch

Sample usage and image, note that some of the legend handles have radius_factor=0.5 because the true size would be too small.

ax_handles, ax_labels = ax.get_legend_handles_labels()
ax_labels.append(AUDIOSET_LABEL)
ax_handles.append(MulticolorCircles([AUDIOSET_COLOR],
                                    face_alpha=LEGEND_SHADOW_ALPHA))
ax_labels.append(FRAUNHOFER_LABEL)
ax_handles.append(MulticolorCircles([FRAUNHOFER_COLOR],
                                    face_alpha=LEGEND_SHADOW_ALPHA))
ax_labels.append(TRAIN_SOURCE_NORMAL_LABEL)
ax_handles.append(MulticolorCircles(SHADOW_COLORS["source"],
                                    face_alpha=LEGEND_SHADOW_ALPHA))
ax_labels.append(TRAIN_TARGET_NORMAL_LABEL)
ax_handles.append(MulticolorCircles(SHADOW_COLORS["target"],
                                    face_alpha=LEGEND_SHADOW_ALPHA))
ax_labels.append(TEST_SOURCE_ANOMALY_LABEL)
ax_handles.append(MulticolorCircles(DOT_COLORS["anomaly_source"],
                                    radius_factor=LEGEND_DOT_RATIO))
ax_labels.append(TEST_TARGET_ANOMALY_LABEL)
ax_handles.append(MulticolorCircles(DOT_COLORS["anomaly_target"],
                                    radius_factor=LEGEND_DOT_RATIO))
#
ax.legend(ax_handles, ax_labels, handlelength=LEGEND_ICON_SIZE,
            borderpad=1.1, labelspacing=1.1,
            handler_map={MulticolorCircles: MulticolorHandler})

enter image description here

Jabberwocky answered 25/6, 2021 at 12:43 Comment(1)
Been searching for a while how to do multicolored circles for a single label. Worked perfectly for me!Airlike
W
1

Probably not exactly what you're looking for, but you can do it (very) manually by placing patches and text yourself on the plot. For instance:

import matplotlib.patches as mpatches
import matplotlib.pyplot as plt

fig, ax = plt.subplots()

red_patch = mpatches.Patch(color='red', label='Foo')
plt.legend(handles=[red_patch])

r1 = mpatches.Rectangle((0.1, 0.1), 0.18, 0.1, fill=False)
r2 = mpatches.Rectangle((0.12, 0.12), 0.03, 0.06, fill=True, color='red')
r3 = mpatches.Rectangle((0.15, 0.12), 0.03, 0.06, fill=True, color='blue')
ax.add_patch(r1)
ax.add_patch(r2)
ax.add_patch(r3)
ax.annotate('Foo', (0.2, 0.13), fontsize='x-large')

plt.show()
Wacke answered 9/8, 2015 at 22:23 Comment(0)
A
0

raphael's answer uses PatchCollection, which drops hatches of its child patches: https://github.com/matplotlib/matplotlib/issues/22654

I find that directly call handlebox.add_artist(patch) after constructing each patch works fine without using PatchCollection, and hatches are well-preserved.

# define an object that will be used by the legend
class MulticolorPatch(object):
    def __init__(self, colors, pattern):
        self.colors = colors
        self.pattern = pattern
class MulticolorPatchHandler(object):
    def legend_artist(self, legend, orig_handle, fontsize, handlebox):
        width, height = handlebox.width, handlebox.height
        for i, c in enumerate(orig_handle.colors):
            patch = plt.Rectangle(
                [
                    width/len(orig_handle.colors) * i - handlebox.xdescent,
                    -handlebox.ydescent,
                ],
                width / len(orig_handle.colors),
                height, 
                facecolor=c, 
                edgecolor='black',
                hatch=orig_handle.pattern,
            )
            if i == 0:
                ret = patch
            handlebox.add_artist(patch)
        return ret

References

https://mcmap.net/q/749194/-combine-two-patches-for-legend

Amory answered 6/12, 2023 at 15:48 Comment(0)

© 2022 - 2024 — McMap. All rights reserved.