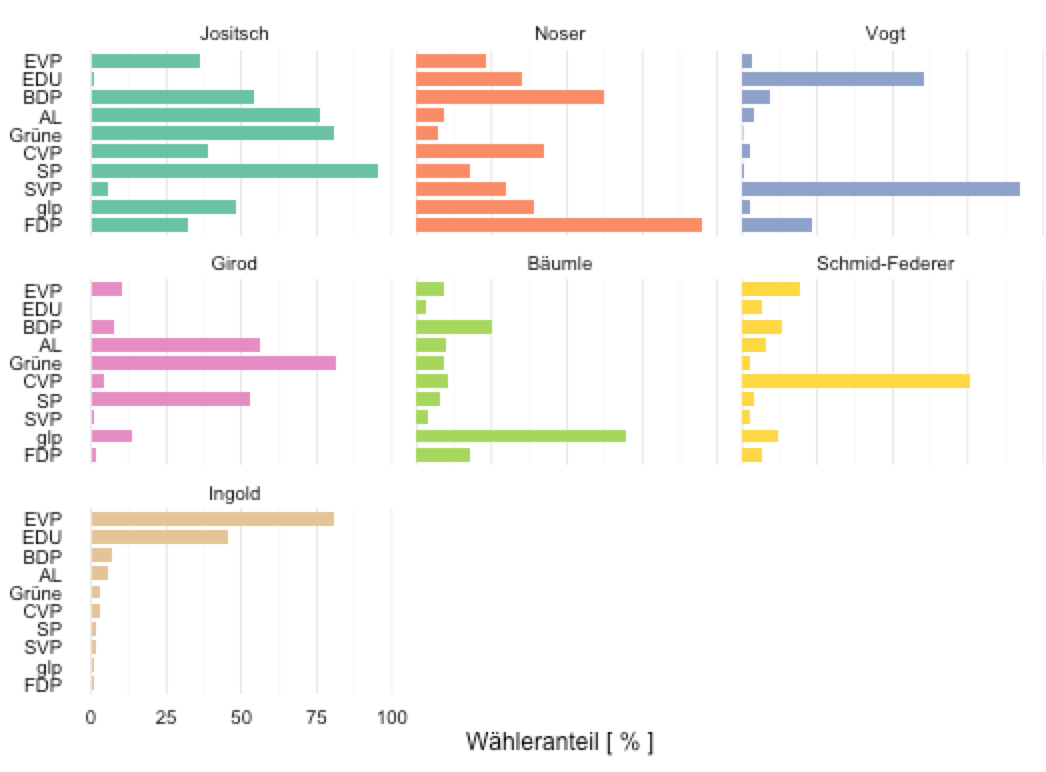
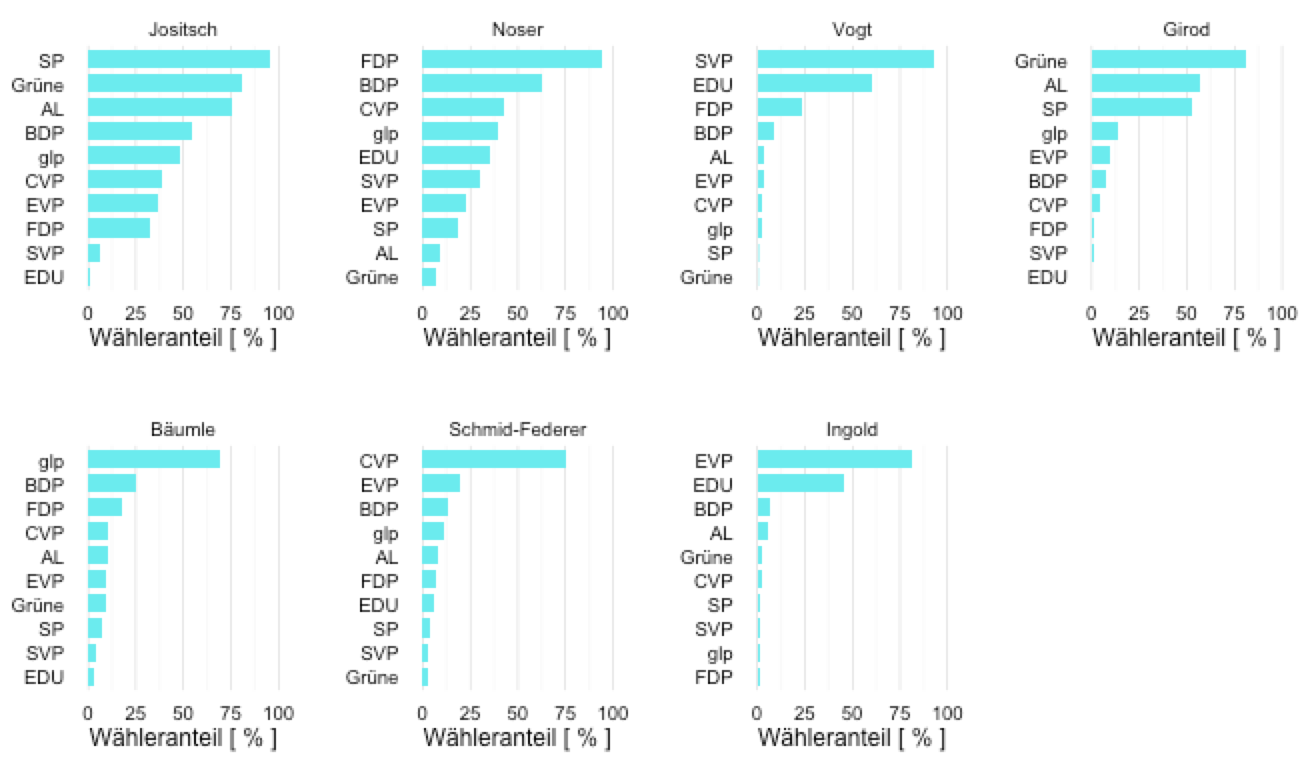
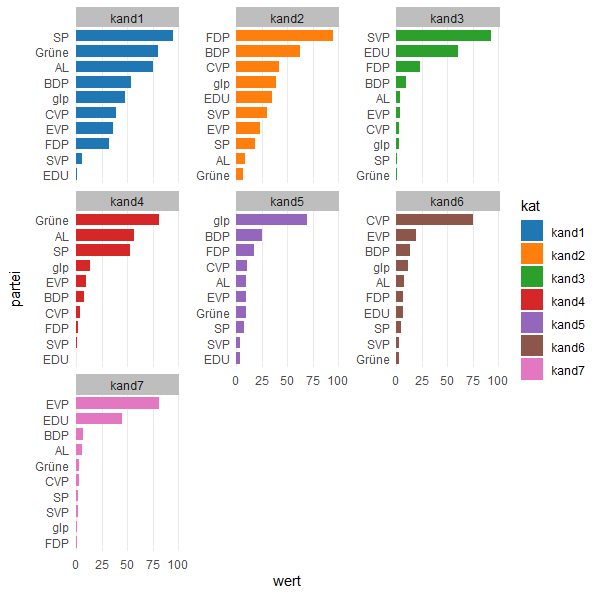
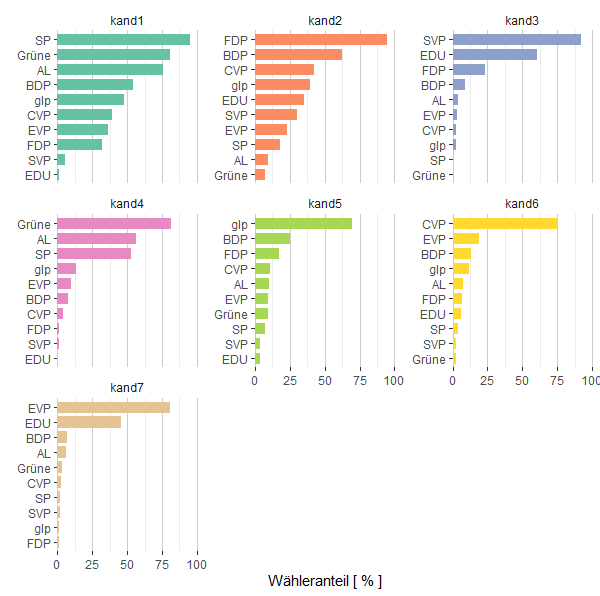
I have a dataframe in R that I want to plot in a faceted ggplot bar chart.
I use this code in ggplot:
ggplot(data_long, aes(x = partei, y = wert, fill = kat, width=0.75)) +
    labs(y = "Wähleranteil [ % ]", x = NULL, fill = NULL) +
    geom_bar(stat = "identity") +
    facet_wrap(~kat) +
    coord_flip() +
    guides(fill=FALSE) +
    theme_bw() + theme( strip.background  = element_blank(),
                        panel.grid.major = element_line(colour = "grey80"),
                        panel.border = element_blank(),
                        axis.ticks = element_line(size = 0),
                        panel.grid.minor.y = element_blank(),
                        panel.grid.major.y = element_blank() ) +
    theme(legend.position="bottom") +
    scale_fill_brewer(palette="Set2")
You can see that only the last facet is in the desired descending order. I would like that all the facets are ordered in descending order, meaning that the label order changes. Therefore I also need that all facets have their own y-axis labels.
This is the data I'm using:
data_long = data.frame(
  partei = c("SP", "Grüne", "AL", "BDP", "glp",
             "CVP", "EVP", "FDP", "SVP", "EDU", "SP", "Grüne", "AL", "BDP",
             "glp", "CVP", "EVP", "FDP", "SVP", "EDU", "SP", "Grüne", "AL",
             "BDP", "glp", "CVP", "EVP", "FDP", "SVP", "EDU", "SP", "Grüne",
             "AL", "BDP", "glp", "CVP", "EVP", "FDP", "SVP", "EDU", "SP",
             "Grüne", "AL", "BDP", "glp", "CVP", "EVP", "FDP", "SVP", "EDU",
             "SP", "Grüne", "AL", "BDP", "glp", "CVP", "EVP", "FDP", "SVP",
             "EDU", "SP", "Grüne", "AL", "BDP", "glp", "CVP", "EVP", "FDP",
             "SVP", "EDU"),
  kat = c("kand1", "kand1", "kand1", "kand1", "kand1",
          "kand1", "kand1", "kand1", "kand1", "kand1", "kand2", "kand2",
          "kand2", "kand2", "kand2", "kand2", "kand2", "kand2", "kand2",
          "kand2", "kand3", "kand3", "kand3", "kand3", "kand3", "kand3",
          "kand3", "kand3", "kand3", "kand3", "kand4", "kand4", "kand4",
          "kand4", "kand4", "kand4", "kand4", "kand4", "kand4", "kand4",
          "kand5", "kand5", "kand5", "kand5", "kand5", "kand5", "kand5",
          "kand5", "kand5", "kand5", "kand6", "kand6", "kand6", "kand6",
          "kand6", "kand6", "kand6", "kand6", "kand6", "kand6", "kand7",
          "kand7", "kand7", "kand7", "kand7", "kand7", "kand7", "kand7",
          "kand7", "kand7"),
  wert = c(95.41, 80.6, 75.77, 54.02, 47.91,
           39.01, 36.2, 32.01, 5.71, 1.1, 18.05, 7.15, 9.02, 62.3, 39.18,
           42.41, 23.14, 94.66, 29.93, 34.97, 0.51, 0.27, 3.92, 9.21, 2.53,
           2.7, 3.52, 23.19, 92.49, 60.64, 52.98, 81.28, 56.42, 7.52, 13.65,
           4.06, 9.96, 1.46, 0.94, 0, 7.51, 9.19, 9.94, 25.3, 69.58, 10.59,
           9.23, 17.61, 3.6, 3.43, 4.29, 2.37, 7.73, 13.14, 11.67, 75.43,
           19.34, 6.52, 2.43, 6.4, 1.87, 2.98, 5.87, 6.7, 1.29, 2.73, 80.91,
           1.1, 1.58, 45.47)
)


katloop through and make the plots, supplying correct order, as a list and then combine with gridExtra'sarrange.grid– Unlookedforlapply(split...., and then use do.call like (here)[#10707253) – Coquelicotappend(plist, p1); assuming that the plot in the loop is called p1 – Pipestone