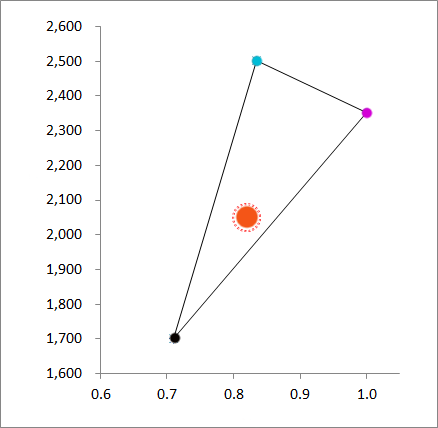
I want to draw a chart like this using ChartJS. But I couldn't find a solution for connect first and last dots and show single unique dot inside that connected area. And also I need to style each dot with different colors. I tried exploring ChartJS documentation but couldn't find a solution. Is there any chart drawing library which has these features or how to do this with ChartJS?
Display line chart with connected dots using chartJS
Asked Answered
can be done with chart.js.. no need for other chart drawing library.. –
Metaprotein
@ɢʀᴜɴᴛ,Thanks. Can you tell me how to do it. I tried with chartjs but didn't success. –
Telepathist
You can create a scatter chart instead of line.
Here is an example :
( tried to replicate your given image amap )
var chart = new Chart(ctx, {
   type: 'scatter',
   data: {
      datasets: [{
         data: [{
            x: 1,
            y: 1
         }, {
            x: 3,
            y: 7
         }, {
            x: 6,
            y: 5
         }, { // add same data as the first one, to draw the closing line
            x: 1,
            y: 1
         }],
         borderColor: 'black',
         borderWidth: 1,
         pointBackgroundColor: ['#000', '#00bcd6', '#d300d6'],
         pointBorderColor: ['#000', '#00bcd6', '#d300d6'],
         pointRadius: 5,
         pointHoverRadius: 5,
         fill: false,
         tension: 0,
         showLine: true
      }, {
         data: [{
            x: 3.5,
            y: 4.5
         }],
         pointBackgroundColor: 'orange',
         pointBorderColor: 'darkorange',
         pointRadius: 10,
         pointHoverRadius: 10
      }]
   },
   options: {
      legend: false,
      tooltips: false,
      scales: {
         xAxes: [{
            ticks: {
               min: 0,
               max: 10
            },
            gridLines: {
               color: '#888',
               drawOnChartArea: false
            }
         }],
         yAxes: [{
            ticks: {
               min: 0,
               max: 8,
               padding: 10
            },
            gridLines: {
               color: '#888',
               drawOnChartArea: false
            }
         }]
      }
   }
});
<script src="https://cdnjs.cloudflare.com/ajax/libs/Chart.js/2.7.0/Chart.min.js"></script>
<canvas id="ctx"></canvas>note : this is just an example, and you can customize it further to fit your need, following the official documentation.
This REALLY helped me figure out a chart I am trying to create! Thanks GRUNT –
Electroplate
Such a great answer - it's very unclear from the official docs that this stuff can be done in chartjs –
Wittie
+1 For the
showLine: true option, in older versions of chart.js it wasn't needed, but after the update it is necessary. –
Benford © 2022 - 2024 — McMap. All rights reserved.

