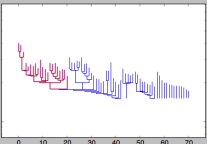
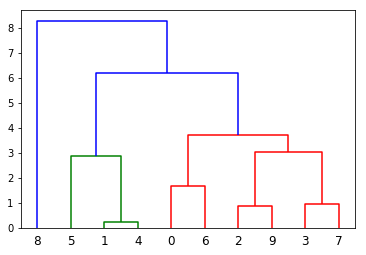
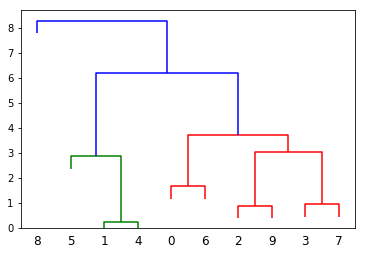
Here is my resulting plot below but I would like it to look like the truncated dendrograms in astrodendro such as this:
There is also a really cool looking dendrogram from this paper that I would like to recreate in matplotlib.
Below is the code for generating an iris data set with noise variables and plotting the dendrogram in matplotlib.
Does anyone know how to either: (1) truncate the branches like in the example figures; and/or (2) to use astrodendro with a custom linkage matrix and labels?
import pandas as pd
import numpy as np
from sklearn.datasets import load_iris
import astrodendro
from scipy.cluster.hierarchy import dendrogram, linkage
from scipy.spatial import distance

def iris_data(noise=None, palette="hls", desat=1):
    # Iris dataset
    X = pd.DataFrame(load_iris().data,
                     index = [*map(lambda x:f"iris_{x}", range(150))],
                     columns = [*map(lambda x: x.split(" (cm)")[0].replace(" ","_"), load_iris().feature_names)])

    y = pd.Series(load_iris().target,
                           index = X.index,
                           name = "Species")
    c = map_colors(y, mode=1, palette=palette, desat=desat)#y.map(lambda x:{0:"red",1:"green",2:"blue"}[x])

    if noise is not None:
        X_noise = pd.DataFrame(
            np.random.RandomState(0).normal(size=(X.shape[0], noise)),
            index=X_iris.index,
            columns=[*map(lambda x:f"noise_{x}", range(noise))]
        )
        X = pd.concat([X, X_noise], axis=1)
    return (X, y, c)

def dism2linkage(DF_dism, method="ward"):
    """
    Input: A (m x m) dissimalrity Pandas DataFrame object where the diagonal is 0
    Output: Hierarchical clustering encoded as a linkage matrix

    Further reading:
    http://docs.scipy.org/doc/scipy-0.14.0/reference/generated/scipy.cluster.hierarchy.linkage.html
    https://pypi.python.org/pypi/fastcluster
    """
    #Linkage Matrix
    Ar_dist = distance.squareform(DF_dism.as_matrix())
    return linkage(Ar_dist,method=method)


# Get data
X_iris_with_noise, y_iris, c_iris = iris_data(50)
# Get distance matrix
df_dism = 1- X_iris_with_noise.corr().abs()
# Get linkage matrix
Z = dism2linkage(df_dism)

#Create dendrogram
with plt.style.context("seaborn-white"):
    fig, ax = plt.subplots(figsize=(13,3))
    D_dendro = dendrogram(
             Z,
             labels=df_dism.index,
             color_threshold=3.5,
             count_sort = "ascending",
             #link_color_func=lambda k: colors[k]
             ax=ax
    )
    ax.set_ylabel("Distance")


