How do I crop an Axes3D plot with square aspect ratio?
Asked Answered
I

3

22

Here's a barebones example:

import matplotlib.pyplot as plt
from mpl_toolkits.mplot3d import Axes3D

fig = plt.figure()
f = fig.add_subplot(2, 1, 1, projection='3d')
t = fig.add_subplot(2, 1, 2, projection='3d')

# axes
for d in {f, t}:
    d.plot([-1, 1], [0, 0], [0, 0], color='k', alpha=0.8, lw=2)
    d.plot([0, 0], [-1, 1], [0, 0], color='k', alpha=0.8, lw=2)
    d.plot([0, 0], [0, 0], [-1, 1], color='k', alpha=0.8, lw=2)

f.dist = t.dist = 5.2   # 10 is default

plt.tight_layout()
f.set_aspect('equal')
t.set_aspect('equal')

r = 6
f.set_xlim3d([-r, r])
f.set_ylim3d([-r, r])
f.set_zlim3d([-r, r])

t.set_xlim3d([-r, r])
t.set_ylim3d([-r, r])
t.set_zlim3d([-r, r])

f.set_axis_off()
t.set_axis_off()

plt.draw()
plt.show()

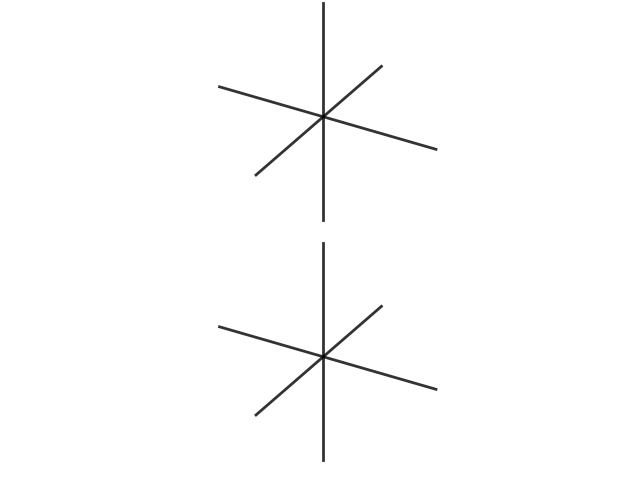
This is what I get:

square viewports

This is what I want:

rectangular viewports

In other words, I want the plots themselves to have a square aspect ratio, not all stretched out like this:

stretched out

and I got that part working thanks to https://mcmap.net/q/120266/-how-to-set-the-39-equal-39-aspect-ratio-for-all-axes-x-y-z

but I want the windows looking into those plots to be rectangular, with the top and bottom cropped out (since there will just be white space on top and bottom and I'm generating multiple animated GIFs so I can't easily post-process it to the shape I want).

Basically I am making this animation, and I want the same thing but without all the whitespace:

animation

Instal answered 8/8, 2015 at 1:48 Comment(8)
I am not usre your example is representative enough, have you tried fig.subplots_adjust(top = 1, bottom = 0, right = 1, left = 0, hspace = 0, wspace = 0)?Alcibiades
Apart from that, you need to tighten your rAlcibiades
@Alcibiades Yeah I shortened one axis from what I actually want, to illustrate them all being the same lengthInstal
I added a bounty to this and still don't have an answer. Do I need to make something more clear?Instal
Are the answers in Setting aspect ratio of 3D plot and matplotlib (mplot3d) - how to increase the size of an axis (stretch) in a 3D Plot? not working? What's different here?Injector
@Injector Which part of those fixes my problem? I don't want to change the aspect ratio, I want to change the amount of whitespace around the plotsInstal
The only problem with the third picture you show is the aspect, right? The links would provide ways to set the aspect; so it seems they would suit your needs.Injector
@Injector The third picture is what I don't want, and is what those answers provide.Instal
A
6

In order to follow up on my comments and show examples by settting a smaller r and removing subplot margins using subplots_adjust:

 
import matplotlib.pyplot as plt
from mpl_toolkits.mplot3d import Axes3D

fig = plt.figure()
f = fig.add_subplot(2, 1, 1, projection='3d')
t = fig.add_subplot(2, 1, 2, projection='3d')

# axes
for d in {f, t}:
    d.plot([-1, 1], [0, 0], [0, 0], color='k', alpha=0.8, lw=2)
    d.plot([0, 0], [-1, 1], [0, 0], color='k', alpha=0.8, lw=2)
    d.plot([0, 0], [0, 0], [-1, 1], color='k', alpha=0.8, lw=2)

f.dist = t.dist = 5.2   # 10 is default

plt.tight_layout()
f.set_aspect('equal')
t.set_aspect('equal')

r = 1
f.set_xlim3d([-r, r])
f.set_ylim3d([-r, r])
f.set_zlim3d([-r, r])

t.set_xlim3d([-r, r])
t.set_ylim3d([-r, r])
t.set_zlim3d([-r, r])

f.set_axis_off()
t.set_axis_off()

fig.subplots_adjust(top = 1, bottom = 0, right = 1, left = 0, 
            hspace = 0, wspace = 0)

plt.draw()
plt.show()

This will give tighter subplots, as the defaults for SubplotParams are as follows:

left : 0.125

right : 0.9

bottom : 0.1

top : 0.9

wspace : 0.2

hspace : 0.2

not sure it is this the OP is looking for though...

enter image description here

Alcibiades answered 10/8, 2016 at 10:13 Comment(1)
each plot is still square, though, I want to make them rectangles while still having equal axesInstal
S
0

Related Matplotlib issue:

One of the devs says:

Yes, the original Axes3D didn't work within the subplot() framework. And subplots leave extra room for the static axes labels, meanwhile, Axes3D needed to account for extra space for its axes labels within the axes plotting area. Originally, this was fine because you didn't make Axes3D objects using subplots, so you didn't get allocated extra margins for axes labels. When it became possible to specify projection='3d' to a subplot call, this had the inadvertent effect of getting extra margin space that wasn't really needed.

I never did figure out a good solution for this that wouldn't act counter-intuitively. Perhaps Axes3D needs to be reworked such that it can interpret and express the margin parameters itself rather than letting it be handled by 2D-based assumptions?

Sacttler answered 21/6, 2023 at 13:49 Comment(0)
T
-1

Since you want rectangular plot, you cannot use set_aspect('equal'), instead you have to adjust the limits of your plots to account for the difference in aspect ratios.

In the attempt below, I've used the bbox of the axis to get the height and width of the axes and used the aspect ratio to rescale X and Y axes. (I assumed both plots have the same dimension, but uou could also have plots with different dimensions, you'll just have to adjust the axes limits independently for each one).

import matplotlib.pyplot as plt
from mpl_toolkits.mplot3d import Axes3D

fig = plt.figure()
f = fig.add_subplot(2, 1, 1, projection='3d')
t = fig.add_subplot(2, 1, 2, projection='3d')

# axes
for d in {f, t}:
    d.plot([-1, 1], [0, 0], [0, 0], color='k', alpha=0.8, lw=2)
    d.plot([0, 0], [-1, 1], [0, 0], color='k', alpha=0.8, lw=2)
    d.plot([0, 0], [0, 0], [-1, 1], color='k', alpha=0.8, lw=2)

f.dist = t.dist = 5.2   # 10 is default

plt.tight_layout()
# Cannot use 'equal' aspect for a rectangular plot
# f.set_aspect('equal')
# t.set_aspect('equal')

# get the dimensions of the axes from its bbox
f_bbox = f.get_position()
f_height = f_bbox.height
f_width = f_bbox.width


r = 6
f.set_xlim3d([-1 * f_width/f_height * r, f_width/f_height * r])
f.set_ylim3d([-1 * f_width/f_height * r, f_width/f_height * r])
f.set_zlim3d([-r, r])

t.set_xlim3d([-1 * f_width/f_height * r, f_width/f_height * r])
t.set_ylim3d([-1 * f_width/f_height * r, f_width/f_height * r])
t.set_zlim3d([-r, r])

f.set_axis_off()
t.set_axis_off()

plt.draw()
plt.show()

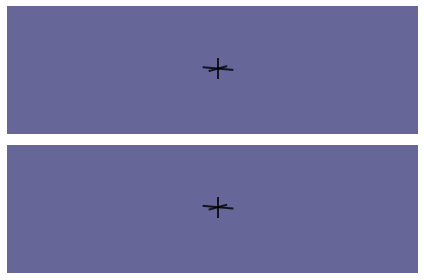
Note: In this picture, I've added a background color to highlight the rectangular shape of the plots

Tasimeter answered 16/8, 2016 at 11:39 Comment(1)
they don't maintain aspect ratio when rotated though. the viewport needs to be cropped into a rectangle, not shrunk into oneInstal

© 2022 - 2024 — McMap. All rights reserved.