Ordering boxplot x-axis in seaborn
Asked Answered
S

2

24

My dataframe round_data looks like this:

      error                         username                    task_path
0      0.02  n49vq14uhvy93i5uw33tf7s1ei07vngozrzlsr6q6cnh8w...    39.png
1      0.10  n49vq14uhvy93i5uw33tf7s1ei07vngozrzlsr6q6cnh8w...    45.png
2      0.15  n49vq14uhvy93i5uw33tf7s1ei07vngozrzlsr6q6cnh8w...    44.png
3      0.25  xdoaztndsxoxk3wycpxxkhaiew3lrsou3eafx3em58uqth...    43.png
...     ...                                                ...       ...
1170  -0.11  9qrz4829q27cu3pskups0vir0ftepql7ynpn6in9hxx3ux...    33.png
1171   0.15  9qrz4829q27cu3pskups0vir0ftepql7ynpn6in9hxx3ux...    34.png


[1198 rows x 3 columns]

I want to have a boxplot showing the error of each user sorted by their average performance. What I have is:

ax = sns.boxplot(
    x='username', 
    y='error', 
    data=round_data,
    whis=np.inf,
    color='c',
    ax=ax
)

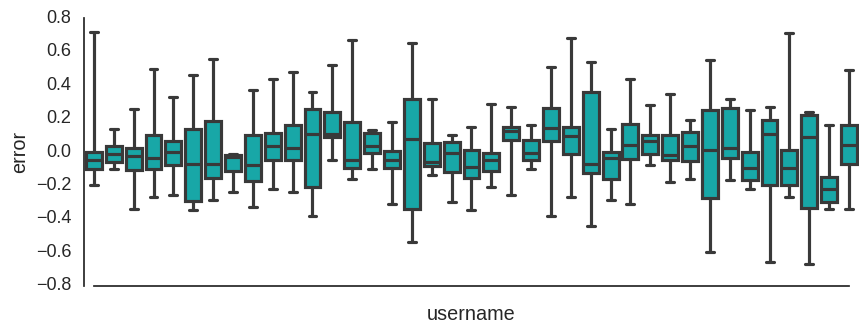
which results into this plot: boxplot

How can I sort the x-axis (i.e., users) by mean error?

Synn answered 9/11, 2016 at 19:54 Comment(0)
S
31

I figured out the answer:

grouped = round_data[round_data.batch==i].groupby('username')
users_sorted_average = (
    pd.DataFrame({col: vals['absolute_error'] for col, vals in grouped})
    .mean()
    .sort_values(ascending=True)
)

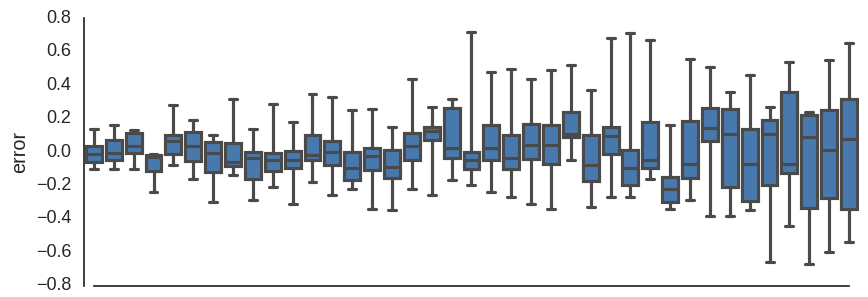
Passing users_sorted_average for the "order" parameter in the seaborn plot function would give the desired behavior:

ax = sns.boxplot(
    x='username', 
    y='error', 
    data=round_data, 
    whis=np.inf,
    ax=ax,
    color=c,
    order=users_sorted_average.index,
)

enter image description here

Synn answered 10/11, 2016 at 1:44 Comment(1)
I'm trying to figure out how to apply this. It would be amazing if I could make this work on my own data. I want to sort by median value. It's a shame this functionality isn't built into the library.Munster
A
1

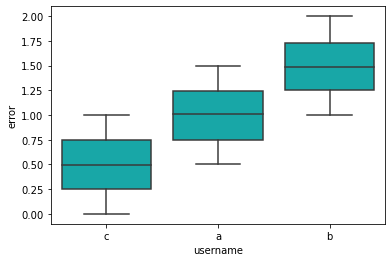
As @amaatouq pointed out, passing the desired order/sorting key to order= does the job. This sorting key has to be an array of the groupers (in OP's case username).

# sample data
df = pd.DataFrame({'username': ['a', 'b', 'c']*1000, 'error': np.random.rand(3000)+[0.5,1,0]*1000, 'col': range(3000)})

# construct sorting key
order = ['c', 'a']          # could also be just a list

order = df.groupby('username')['col'].median().sort_values().index
#                                    ^^^^^^^   sort by median col

order = df.groupby('username')['error'].mean().sort_values().index
#                                      ^^^^^^^   sort by mean error

sns.boxplot(x='username', y='error', data=df, whis=np.inf, color='c', order=order);

result


As a side note, if you're using a pandas dataframe (as in the OP), pandas has a boxplot method that could be used as well; just need to reshape the dataframe (via pivot) first so that each box becomes it's own column.

df.pivot(values='error', columns='username').pipe(lambda x: x[x.mean().sort_values().index]).boxplot(color='c', grid=False)
# ^^^^^^ reshape dataframe                                  ^^^^^^^^^^ sort by mean "error"  ^^^^^^^ plot boxplot
Antistrophe answered 3/5, 2023 at 17:2 Comment(0)

© 2022 - 2024 — McMap. All rights reserved.