Scatter plot with legend for each color in c
Asked Answered
P

5

29

I want to create a Matplotlib scatter plot, with a legend showing the color for each class. For example, I have a list of x and y values, and a list of classes values. Each element in the x, y and classes lists corresponds to one point in the plot. I want each class to have its own color, which I have already coded, but then I want the classes to be displayed in a legend. What parameters do I pass to the legend() function to achieve this?

Here is my code so far:

import matplotlib.pyplot as plt
x = [1, 3, 4, 6, 7, 9]
y = [0, 0, 5, 8, 8, 8]
classes = ['A', 'A', 'B', 'C', 'C', 'C']
colors = ['r', 'r', 'b', 'g', 'g', 'g']
plt.scatter(x, y, c=colors)
plt.show()
Purapurblind answered 25/10, 2014 at 2:36 Comment(0)
U
24

First, I have a feeling you meant to use apostrophes, not backticks when declaring colours.

For a legend you need some shapes as well as the classes. For example, the following creates a list of rectangles called recs for each colour in class_colours.

import matplotlib.patches as mpatches

classes = ['A','B','C']
class_colours = ['r','b','g']
recs = []
for i in range(0,len(class_colours)):
    recs.append(mpatches.Rectangle((0,0),1,1,fc=class_colours[i]))
plt.legend(recs,classes,loc=4)

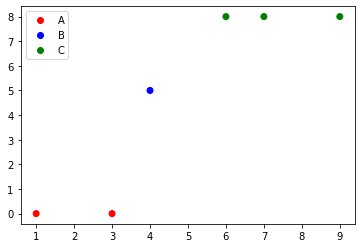
Output from first code block

There is a second way of creating a legend, in which you specify the "Label" for a set of points using a separate scatter command for each set. An example of this is given below.

classes = ['A','A','B','C','C','C']
colours = ['r','r','b','g','g','g']
for (i,cla) in enumerate(set(classes)):
    xc = [p for (j,p) in enumerate(x) if classes[j]==cla]
    yc = [p for (j,p) in enumerate(y) if classes[j]==cla]
    cols = [c for (j,c) in enumerate(colours) if classes[j]==cla]
    plt.scatter(xc,yc,c=cols,label=cla)
plt.legend(loc=4)

enter image description here

The first method is the one I've personally used, the second I just found looking at the matplotlib documentation. Since the legends were covering datapoints I moved them, and the locations for legends can be found here. If there's another way to make a legend, I wasn't able to find it after a few quick searches in the docs.

Untouchability answered 25/10, 2014 at 4:11 Comment(0)
F
21

if you are using matplotlib version 3.1.1 or above, you can try:

import matplotlib.pyplot as plt
from matplotlib.colors import ListedColormap

x = [1, 3, 4, 6, 7, 9]
y = [0, 0, 5, 8, 8, 8]
classes = ['A', 'A', 'B', 'C', 'C', 'C']
values = [0, 0, 1, 2, 2, 2]
colours = ListedColormap(['r','b','g'])
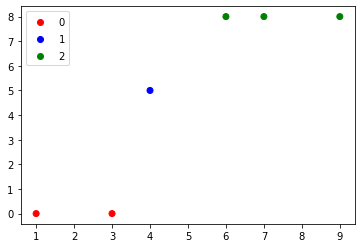
scatter = plt.scatter(x, y,c=values, cmap=colours)
plt.legend(*scatter.legend_elements())

result1

Furthermore, to replace labels with classes names, we only need handles from scatter.legend_elements:

import matplotlib.pyplot as plt
from matplotlib.colors import ListedColormap

x = [1, 3, 4, 6, 7, 9]
y = [0, 0, 5, 8, 8, 8]
classes = ['A', 'B', 'C']
values = [0, 0, 1, 2, 2, 2]
colours = ListedColormap(['r','b','g'])
scatter = plt.scatter(x, y,c=values, cmap=colours)
plt.legend(handles=scatter.legend_elements()[0], labels=classes)

results2

Ferule answered 23/10, 2019 at 5:42 Comment(0)
P
8

There are two ways to do it. One of them gives you legend entries for each thing you plot, and the other one lets you put whatever you want in the legend, stealing heavily from this answer.

Here's the first way:

import matplotlib.pyplot as plt
import numpy as np

x = np.linspace(-1,1,100)

fig = plt.figure()
ax = fig.add_subplot(1,1,1)

#Plot something
ax.plot(x,x, color='red', ls="-", label="$P_1(x)$")
ax.plot(x,0.5 * (3*x**2-1), color='green', ls="--", label="$P_2(x)$")
ax.plot(x,0.5 * (5*x**3-3*x), color='blue', ls=":", label="$P_3(x)$")

ax.legend()
plt.show()

enter image description here

The ax.legend() function has more than one use, the first just creates the legend based on the lines in axes object, the second allwos you to control the entries manually, and is described here.

You basically need to give the legend the line handles, and associated labels.

The other way allows you to put whatever you want in the legend, by creating the Artist objects and labels, and passing them to the ax.legend() function. You can either use this to only put some of your lines in the legend, or you can use it to put whatever you want in the legend.

import matplotlib.pyplot as plt
import numpy as np

x = np.linspace(-1,1,100)

fig = plt.figure()
ax = fig.add_subplot(1,1,1)

#Plot something
p1, = ax.plot(x,x, color='red', ls="-", label="$P_1(x)$")
p2, = ax.plot(x,0.5 * (3*x**2-1), color='green', ls="--", label="$P_2(x)$")
p3, = ax.plot(x,0.5 * (5*x**3-3*x), color='blue', ls=":", label="$P_3(x)$")

#Create legend from custom artist/label lists
ax.legend([p1,p2], ["$P_1(x)$", "$P_2(x)$"])

plt.show()

enter image description here

Or here, we create new Line2D objects, and give them to the legend.

import matplotlib.pyplot as pltit|delete|flag
import numpy as np
import matplotlib.patches as mpatches

x = np.linspace(-1,1,100)

fig = plt.figure()
ax = fig.add_subplot(1,1,1)

#Plot something
p1, = ax.plot(x,x, color='red', ls="-", label="$P_1(x)$")
p2, = ax.plot(x,0.5 * (3*x**2-1), color='green', ls="--", label="$P_2(x)$")
p3, = ax.plot(x,0.5 * (5*x**3-3*x), color='blue', ls=":", label="$P_3(x)$")

fakeLine1 = plt.Line2D([0,0],[0,1], color='Orange', marker='o', linestyle='-')
fakeLine2 = plt.Line2D([0,0],[0,1], color='Purple', marker='^', linestyle='')
fakeLine3 = plt.Line2D([0,0],[0,1], color='LightBlue', marker='*', linestyle=':')

#Create legend from custom artist/label lists
ax.legend([fakeLine1,fakeLine2,fakeLine3], ["label 1", "label 2", "label 3"])

plt.show()

enter image description here

I also tried to get the method using patches to work, as on the matplotlib legend guide page, but it didn't seem to work so i gave up.

Pose answered 25/10, 2014 at 11:1 Comment(0)
S
5

This is easily handled in seaborn's scatterplot. Here's an implementation of it.

import matplotlib.pyplot as plt
import seaborn as sns

x = [1, 3, 4, 6, 7, 9]
y = [0, 0, 5, 8, 8, 8]
classes = ['A', 'A', 'B', 'C', 'C', 'C']
colours = ['r', 'r', 'b', 'g', 'g', 'g']

sns.scatterplot(x=x, y=y, hue=classes)
plt.show()

plot

Seduction answered 9/8, 2018 at 11:11 Comment(0)
B
1

In my project,i also want to create an empty scatter legend.Here is my solution:

from mpl_toolkits.basemap import Basemap
#use the scatter function from matplotlib.basemap
#you can use pyplot or other else.
select = plt.scatter([], [],s=200,marker='o',linewidths='3',edgecolor='#0000ff',facecolors='none',label=u'监测站点') 
plt.legend(handles=[select],scatterpoints=1)

Take care of "label","scatterpoints"in above.

Belvia answered 12/1, 2016 at 2:58 Comment(0)

© 2022 - 2024 — McMap. All rights reserved.