I want to know how much time an import takes for both built-in as well as user defined modules.
Starting from Python 3.7 release, new -X importtime option is available.
To measure import time, just simply execute your script with that option, e.g. python -X importtime my_script.py.
For reference:
tuna. taken from here: github.com/nschloe/tuna –
Acclaim To find out how long an import takes, the simplest way is probably using the timeit module..
>>> import timeit
>>> t = timeit.Timer('import urllib')
>>> t.timeit(number = 1000000)
0.98621106147766113
So to import urllib 1 million times, it took just under a second (on a Macbook Pro).
i have a master script that imports other modules.I need to calculate how much time it takes
If you mean the total script execution time, on Linux/OS X/Cygwin, you can run the script using the time command, for example:
$ time python myscript.py

real    0m0.046s
user    0m0.024s
sys     0m0.020s
(remember that includes all the Python interpreter startup time, as well as the actual code execution time, although it's pretty trivial amount)
Another, possibly more useful way is to profile the script:
Instead of running your code with
$ python myscript.py
you use
$ python -m cProfile myscript.py
         1059 function calls in 0.015 CPU seconds

   Ordered by: standard name

   ncalls  tottime  percall  cumtime  percall filename:lineno(function)
        1    0.000    0.000    0.000    0.000 <string>:1(<module>)
        1    0.002    0.002    0.015    0.015 myscript.py:1(<module>)
   [...]
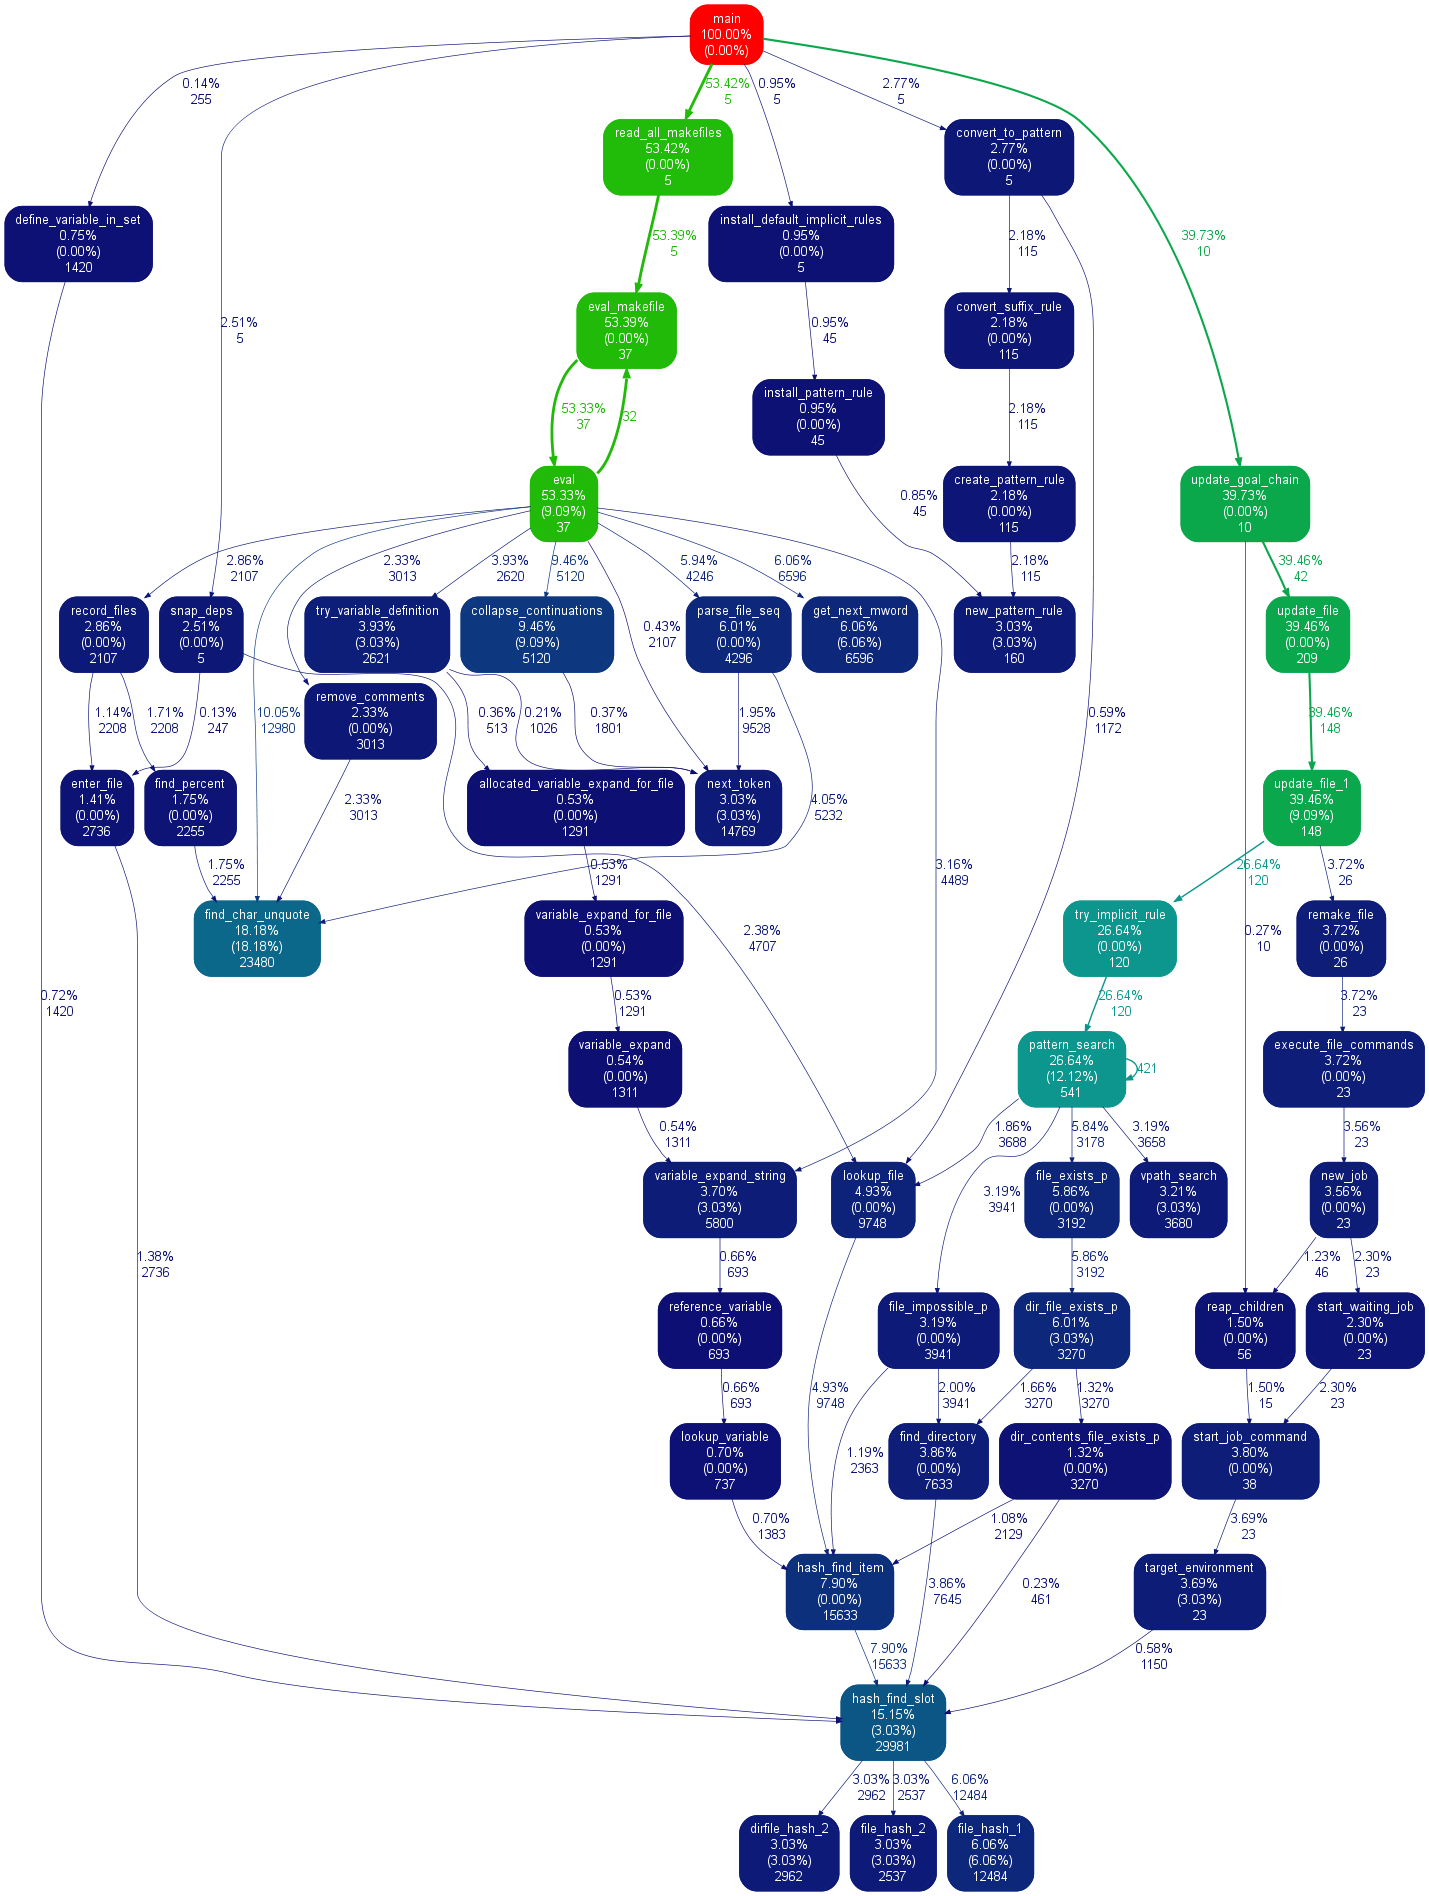
I don't find the command line output very easy to read, so I almost always use gprof2dot, which turns the profiling information into a pretty graphviz graph:
$ python -m cProfile -o myscript.prof myscript.py
$ python gprof2dot.py -o myscript.dot -f pstats myscript.prof
$ dot -Tpng -o profile.png prof_runtest.dot -Gbgcolor=black
Image source (1429x1896px PNG): http://jrfonseca.googlecode.com/svn/wiki/gprof2dot.png (mirror)
reload(module) doesn't have the same behavior as importing from scratch, either. To truly answer the author's question is actually pretty difficult, unless the time to import is large enough that measuring one call at a time is reasonable. –
Unloose One way to profile imports is to use the profile_imports module used in bzr source code:
# put those two lines at the top of your script
import profile_imports
profile_imports.install()

# display the results
profile_imports.log_stack_info(sys.stderr)
Besides giving you timing for imports, this also estimates time to compile regex, which is often a significant cause for slowdown in imports.
You can test this runnning
$ time python -c "import math"
However, what would this help you? Importing only happens once and will almost never be a bottle neck. Importing the same module over and over will not run significantly slower than importing it once, since Python tracks which modules have already been imported.
What are you actually trying to achieve?
Use cProfile:
python -m cProfile yourscript.py
I ran into this issue profiling a large legacy application with a multi-second startup time. It's relatively simple to replace the builtin importer with something that does some profiling. Below is a hacky way of showing approximately how long each module takes to execute:
import os
import sys
import time


class ImportEventNode(object):
    def __init__(self, name, start_time, children=None, end_time=None):
        self.name = name
        self.start_time = start_time
        self.children = [] if children is None else children
        self.end_time = end_time

    def __repr__(self):
        return 'ImportEventNode({self.name}, {self.start_time}, children={self.children}, end_time={self.end_time})'.format(self=self)

    @property
    def total_time(self):
        return self.end_time - self.start_time

    @property
    def net_time(self):
        return self.total_time - sum(child.total_time for child in self.children)


root_node = cur_node = None

all_nodes = []
old_import = __import__
def __import__(*args, **kwargs):
    global root_node, cur_node
    name = args[0]
    if name not in sys.modules:
        t0 = time.time()
        if root_node is None:
            root_node = prev_node = cur_node = lcur_node = ImportEventNode(args[0], t0)
        else:
            prev_node = cur_node
            cur_node = lcur_node = ImportEventNode(name, t0)
            prev_node.children.append(cur_node)
        try:
            ret = old_import(*args, **kwargs)
        finally:
            lcur_node.end_time = time.time()
        all_nodes.append(lcur_node)
        cur_node = prev_node
        return ret
    else:
        return old_import(*args, **kwargs)


__builtins__.__import__ = __import__
Running on a simple example, here's how it looks on importing scipy.stats:
:import scipy.stats
:
:nodes = sorted(all_nodes, key=(lambda x: x.net_time), reverse=True)
:for node in nodes[:10]:
:    print(node.name, node.net_time)
:
:<EOF>
('pkg_resources', 0.08431100845336914)
('', 0.05861020088195801)
('decomp_schur', 0.016885995864868164)
('PIL', 0.0143890380859375)
('scipy.stats', 0.010602712631225586)
('pkg_resources._vendor.packaging.specifiers', 0.007072925567626953)
('add_newdocs', 0.00637507438659668)
('mtrand', 0.005497932434082031)
('scipy.sparse.linalg', 0.005171060562133789)
('scipy.linalg', 0.004471778869628906)
Tested on Windows in Python 2.4 - you can try it yourself.
>>> import time

>>> ## Built-in module
>>> def testTime():
        now = time.clock() # use time.time() on unix-based systems
        import math
        print time.clock() - now

>>> testTime()
7.54285810167e-006


>>> ## My own module
>>> def testTime():
        now = time.clock()
        import myBuiltInModule # Not its actual name ;-)
        print time.clock() - now

>>> testTime()
0.00253174635324
>>> testTime()
3.70158777141e-006
So there is a big difference between cached modules and those being brought in from scratch. To illustrate, we can reload the module:
>>> def testTime():
        now = time.clock()
        reload(myBuiltInModule )
        print time.clock() - now


>>> testTime()
0.00250017809526
This is extension to szymon and skjern suggestion of combining Python Profilers and tuna.
First install tuna
pip install tuna
Then, create a python extension file and name it to whatever you desire. here we name it as timit_package.py.
Within this file, include both built-in as well as user defined modules.
Here, I only test
import mne
Then, in the terminal
python -mcProfile -o program.prof timit_package.py
wait for few sec, then paste the following line into the terminal
tuna program.prof
A browser along with the profile will be generated.
Im testing this with python 3.9
© 2022 - 2024 — McMap. All rights reserved.


