No, SQL A left join B, isn't just A.
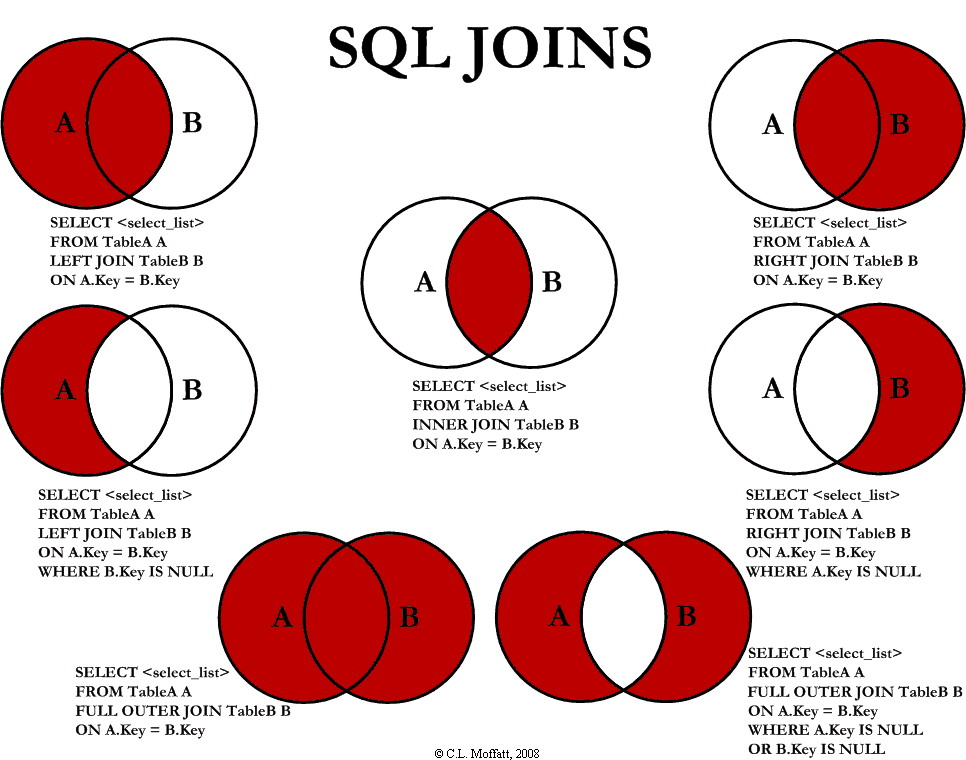
In the Venn diagram depicted in the OP, the first join (top left) is a left join. A left join returns all rows from the left table (A), and the matching rows from the right table (B). If there are no matching rows in the right table, the left table rows are returned with NULL values for the columns from the right table.
In the Venn diagram, the left table is represented by the circle on the left, and the right table is represented by the circle on the right. The intersection of the two circles represents the rows that are in both tables. The left join returns all of the rows in the left circle, and the matching rows in the right circle. The rows in the left circle that do not have a matching row in the right circle are returned with NULL values for the columns from the right table.
So, in the Venn diagram, the top left join returns all of the rows in the left circle, which is the table A. The rows in the right circle that do not have a matching row in the left circle are not returned.
The confusion may arise when looking at a Venn diagram representation of a left join. Venn diagrams are typically used to represent set operations like union, intersection, and difference, which can be related to SQL operations like UNION, INTERSECT, and EXCEPT. However, when it comes to joins, Venn diagrams may not accurately represent the concept.
In a Venn diagram, the overlapping region represents the intersection of sets. But in a left join, the overlapping region would actually represent the matching rows between table A and table B. The left table (A) would be represented by a circle, and the right table (B) would be represented by another circle. The overlapping region would show the rows that have a match based on the join condition.
To summarize: Venn diagrams are OK as long as they make clear that the graphic representation of UNION, INTERSECT, EXCEPT set operations to describe a JOIN, refer to the cartesian products of table A and table B, not to the table themselves.

