How to extract a table as text from the PDF
Asked Answered
U

4

54

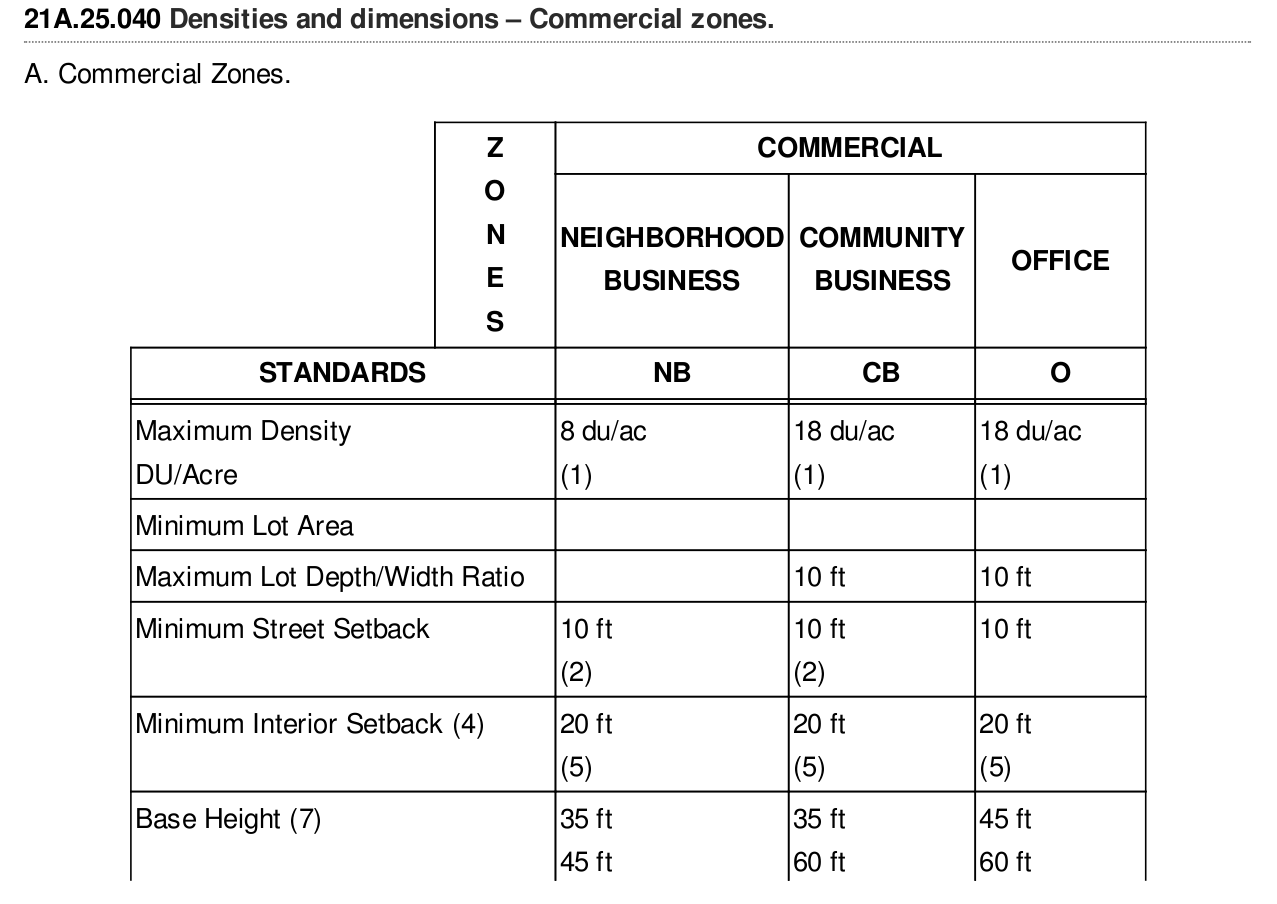
I have a PDF which contains Tables, text and some images. I want to extract the table wherever tables are there in the PDF.

Right now am doing manually to find the Table from the page. From there I am capturing that page and saving into another PDF.

import pypdf import PdfReader, PdfWriter

filename = "Sammamish.pdf"
reader = PdfReader(filename)

page = reader.pages[126]

writer = PdfWriter()
writer.add_page(page)

new_filename = "allTables.pdf"
with open(new_filename, "wb") as output_stream:
    writer.write(output_stream)

My goal is to extract the table from the whole PDF document.

Please have a look at the sample image of a page in PDF

Unsatisfactory answered 28/11, 2017 at 14:23 Comment(3)
Try SLICEmyPDF in 1 of the answers at #56018202Slavism
We should distinguish extracting tables from images using OCR and extracting tables from non-scanned PDFsConlon
See also: Why is extracting tabular data from PDF files hard?Conlon
M
26

This answer is for anyone encountering pdfs with images and needing to use OCR. I could not find a workable off-the-shelf solution; nothing that gave me the accuracy I needed.

Here are the steps I found to work.

  1. Use pdfimages from https://poppler.freedesktop.org/ to turn the pages of the pdf into images.

  2. Use Tesseract to detect rotation and ImageMagick mogrify to fix it.

  3. Use OpenCV to find and extract tables.

  4. Use OpenCV to find and extract each cell from the table.

  5. Use OpenCV to crop and clean up each cell so that there is no noise that will confuse OCR software.

  6. Use Tesseract to OCR each cell.

  7. Combine the extracted text of each cell into the format you need.

I wrote a python package with modules that can help with those steps.

Repo: https://github.com/eihli/image-table-ocr

Docs & Source: https://eihli.github.io/image-table-ocr/pdf_table_extraction_and_ocr.html

Some of the steps don't require code, they take advantage of external tools like pdfimages and tesseract. I'll provide some brief examples for a couple of the steps that do require code.

  1. Finding tables:

This link was a good reference while figuring out how to find tables. https://answers.opencv.org/question/63847/how-to-extract-tables-from-an-image/

import cv2

def find_tables(image):
    BLUR_KERNEL_SIZE = (17, 17)
    STD_DEV_X_DIRECTION = 0
    STD_DEV_Y_DIRECTION = 0
    blurred = cv2.GaussianBlur(image, BLUR_KERNEL_SIZE, STD_DEV_X_DIRECTION, STD_DEV_Y_DIRECTION)
    MAX_COLOR_VAL = 255
    BLOCK_SIZE = 15
    SUBTRACT_FROM_MEAN = -2

    img_bin = cv2.adaptiveThreshold(
        ~blurred,
        MAX_COLOR_VAL,
        cv2.ADAPTIVE_THRESH_MEAN_C,
        cv2.THRESH_BINARY,
        BLOCK_SIZE,
        SUBTRACT_FROM_MEAN,
    )
    vertical = horizontal = img_bin.copy()
    SCALE = 5
    image_width, image_height = horizontal.shape
    horizontal_kernel = cv2.getStructuringElement(cv2.MORPH_RECT, (int(image_width / SCALE), 1))
    horizontally_opened = cv2.morphologyEx(img_bin, cv2.MORPH_OPEN, horizontal_kernel)
    vertical_kernel = cv2.getStructuringElement(cv2.MORPH_RECT, (1, int(image_height / SCALE)))
    vertically_opened = cv2.morphologyEx(img_bin, cv2.MORPH_OPEN, vertical_kernel)

    horizontally_dilated = cv2.dilate(horizontally_opened, cv2.getStructuringElement(cv2.MORPH_RECT, (40, 1)))
    vertically_dilated = cv2.dilate(vertically_opened, cv2.getStructuringElement(cv2.MORPH_RECT, (1, 60)))

    mask = horizontally_dilated + vertically_dilated
    contours, hierarchy = cv2.findContours(
        mask, cv2.RETR_EXTERNAL, cv2.CHAIN_APPROX_SIMPLE,
    )

    MIN_TABLE_AREA = 1e5
    contours = [c for c in contours if cv2.contourArea(c) > MIN_TABLE_AREA]
    perimeter_lengths = [cv2.arcLength(c, True) for c in contours]
    epsilons = [0.1 * p for p in perimeter_lengths]
    approx_polys = [cv2.approxPolyDP(c, e, True) for c, e in zip(contours, epsilons)]
    bounding_rects = [cv2.boundingRect(a) for a in approx_polys]

    # The link where a lot of this code was borrowed from recommends an
    # additional step to check the number of "joints" inside this bounding rectangle.
    # A table should have a lot of intersections. We might have a rectangular image
    # here though which would only have 4 intersections, 1 at each corner.
    # Leaving that step as a future TODO if it is ever necessary.
    images = [image[y:y+h, x:x+w] for x, y, w, h in bounding_rects]
    return images
  1. Extract cells from table.

This is very similar to 2, so I won't include all the code. The part I will reference will be in sorting the cells.

We want to identify the cells from left-to-right, top-to-bottom.

We’ll find the rectangle with the most top-left corner. Then we’ll find all of the rectangles that have a center that is within the top-y and bottom-y values of that top-left rectangle. Then we’ll sort those rectangles by the x value of their center. We’ll remove those rectangles from the list and repeat.

def cell_in_same_row(c1, c2):
    c1_center = c1[1] + c1[3] - c1[3] / 2
    c2_bottom = c2[1] + c2[3]
    c2_top = c2[1]
    return c2_top < c1_center < c2_bottom

orig_cells = [c for c in cells]
rows = []
while cells:
    first = cells[0]
    rest = cells[1:]
    cells_in_same_row = sorted(
        [
            c for c in rest
            if cell_in_same_row(c, first)
        ],
        key=lambda c: c[0]
    )

    row_cells = sorted([first] + cells_in_same_row, key=lambda c: c[0])
    rows.append(row_cells)
    cells = [
        c for c in rest
        if not cell_in_same_row(c, first)
    ]

# Sort rows by average height of their center.
def avg_height_of_center(row):
    centers = [y + h - h / 2 for x, y, w, h in row]
    return sum(centers) / len(centers)

rows.sort(key=avg_height_of_center)
Manteltree answered 25/4, 2020 at 19:50 Comment(1)
I don't understand why a moderator (@martijn-pieters) delete my previous post (stackoverflow.com/posts/47714252/revisions) ?Malodorous
H
23
  • I would suggest you to extract the table using tabula.
  • Pass your pdf as an argument to the tabula api and it will return you the table in the form of dataframe.
  • Each table in your pdf is returned as one dataframe.
  • The table will be returned in a list of dataframea, for working with dataframe you need pandas.

This is my code for extracting pdf.

import pandas as pd
import tabula
file = "filename.pdf"
path = 'enter your directory path here'  + file
df = tabula.read_pdf(path, pages = '1', multiple_tables = True)
print(df)

Please refer to this repo of mine for more details.

Hadwin answered 29/10, 2018 at 17:1 Comment(2)
This works only with Text based PDF and not scanned PDFGalengalena
For scanned pdf use image processing techniques, there are plenty tools out thereHadwin
U
2

If your pdf is text-based and not a scanned document (i.e. if you can click and drag to select text in your table in a PDF viewer), then you can use the module camelot-py with

import camelot
tables = camelot.read_pdf('foo.pdf')

You then can choose how you want to save the tables (as csv, json, excel, html, sqlite), and whether the output should be compressed in a ZIP archive.

tables.export('foo.csv', f='csv', compress=False)

Edit: tabula-py appears roughly 6 times faster than camelot-py so that should be used instead.

import camelot
import cProfile
import pstats
import tabula

cmd_tabula = "tabula.read_pdf('table.pdf', pages='1', lattice=True)"
prof_tabula = cProfile.Profile().run(cmd_tabula)
time_tabula = pstats.Stats(prof_tabula).total_tt

cmd_camelot = "camelot.read_pdf('table.pdf', pages='1', flavor='lattice')"
prof_camelot = cProfile.Profile().run(cmd_camelot)
time_camelot = pstats.Stats(prof_camelot).total_tt

print(time_tabula, time_camelot, time_camelot/time_tabula)

gave

1.8495559890000015 11.057014036000016 5.978199147125147
Usurer answered 29/10, 2020 at 14:51 Comment(0)
T
-3

Extract table as text from the PDF using Python pdfminer

from pprint import pprint
from io import StringIO
import re
from pdfminer.high_level import extract_text_to_fp
from pdfminer.layout import LAParams
from lxml import html
ID_LEFT_BORDER = 56
ID_RIGHT_BORDER = 156
QTY_LEFT_BORDER = 355
QTY_RIGHT_BORDER = 455
# Read PDF file and convert it to HTML
output = StringIO()
with open('example.pdf', 'rb') as pdf_file:
    extract_text_to_fp(pdf_file, output, laparams=LAParams(), output_type='html', codec=None)
raw_html = output.getvalue()
# Extract all DIV tags
tree = html.fromstring(raw_html)
divs = tree.xpath('.//div')
# Sort and filter DIV tags
filtered_divs = {'ID': [], 'Qty': []}
for div in divs:
    # extract styles from a tag
    div_style = div.get('style')
    # print(div_style)
    # position:absolute; border: textbox 1px solid; writing-mode:lr-tb; left:292px; top:1157px; width:27px; height:12px;
# get left position
    try:
        left = re.findall(r'left:([0-9]+)px', div_style)[0]
    except IndexError:
        continue
# div contains ID if div's left position between ID_LEFT_BORDER and ID_RIGHT_BORDER
    if ID_LEFT_BORDER < int(left) < ID_RIGHT_BORDER:
        filtered_divs['ID'].append(div.text_content().strip('\n'))
# div contains Quantity if div's left position between QTY_LEFT_BORDER and QTY_RIGHT_BORDER
    if QTY_LEFT_BORDER < int(left) < QTY_RIGHT_BORDER:
        filtered_divs['Qty'].append(div.text_content().strip('\n'))
# Merge and clear lists with data
data = []
for row in zip(filtered_divs['ID'], filtered_divs['Qty']):
    if 'ID' in row[0]:
        continue
    data_row = {'ID': row[0].split(' ')[0], 'Quantity': row[1]}
    data.append(data_row)
pprint(data)
Tollefson answered 24/11, 2021 at 17:17 Comment(0)

© 2022 - 2024 — McMap. All rights reserved.