Visual Studio Code with Python: Timeout waiting for debugger connection
Asked Answered
I

17

62

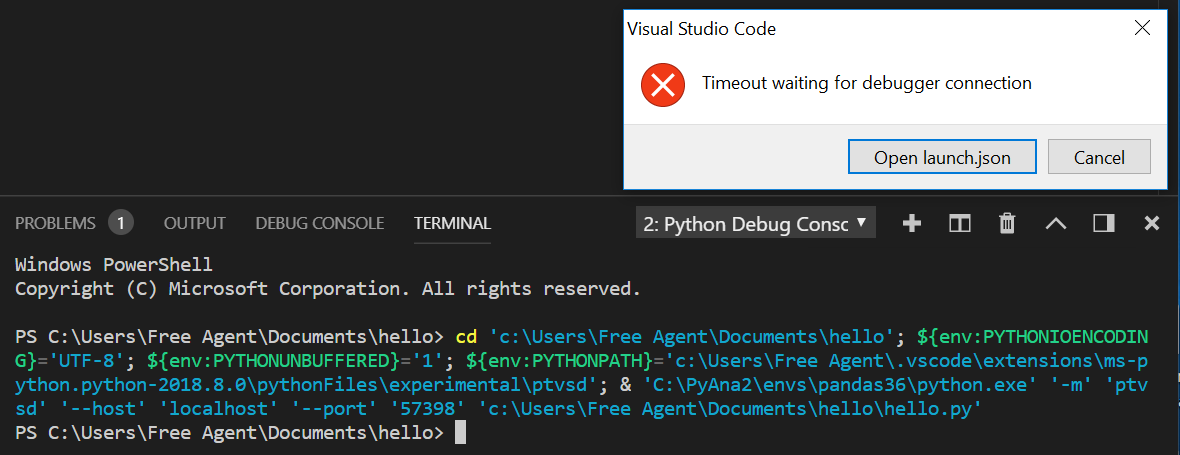
I'm running the Visual Studio Code tutorial with Python and am unable to connect to the debugger. Usually I use Anaconda with Jupyter, so I'm connecting Visual Studio Code to Python in my activated 3.6 virtual environment. I tried pip installing ptvsd in my virtual environment, but that did not make a difference in what I am seeing.

enter image description here

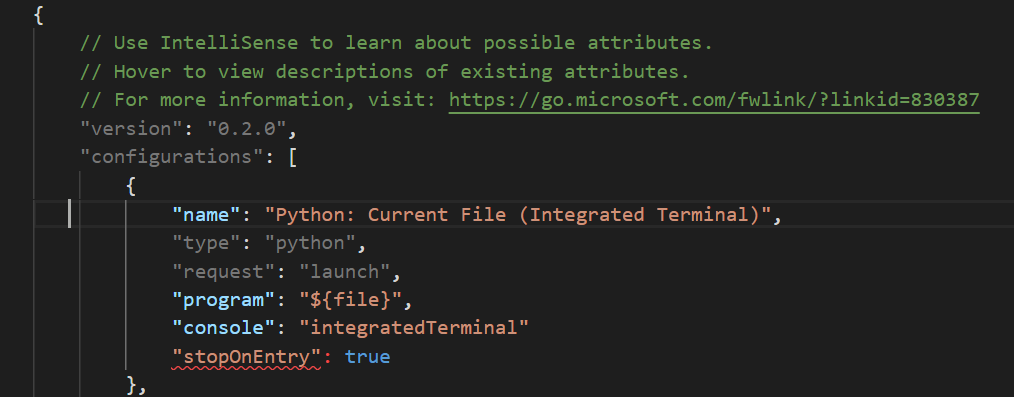
My launch.json (I've since added a comma to remove the red underline; that is not the issue):

enter image description here

Inhabit answered 23/9, 2018 at 3:3 Comment(1)
At this point you probably need to open an issue at github.com/microsoft/vscode-python to figure out what's going on. Please fill out the issue template when you do and if you can please provide sample code that can reproduce the issue.Lunnete
S
82

Open the launch.json file and add the following configuration:

{
    "name": "Python: Debug Console",
    "type": "python",
    "request": "launch",
    "program": "${file}",
    "console": "internalConsole"
}

When you specify none internalConsole for the console, it will run the debugger in the debugger console instead of running in the internal or external terminal.

Sidonia answered 12/10, 2018 at 13:57 Comment(3)
as of 2022 the "internalConsole" method does not work consistently.Monahon
@D.L you should expand on that. Just saying doesnt work consistently doesn't say muchDecapod
this internalConsole setting mght or does have an issue re input #73994077Decapod
I
15

I had the same issue, so I added the following line to the settings.json file:

{
    // to fix 'Timeout waiting for debugger connections'
    "python.terminal.activateEnvironment": false
}
Igneous answered 24/12, 2018 at 17:15 Comment(1)
a few years from the answer, but this fix does not work.Monahon
U
14

I had this same problem today. I think it might be a connection problem when the debugger tries to connect to an integrated PowerShell terminal inside Visual Studio. If I change to using an external terminal to run the program then it works okay, and the debugger connects to the external terminal and I can debug perfectly fine. This is my entry for the external terminal launch in launch.json

{
    "name": "Python: Terminal (external)",
    "type": "python",
    "request": "launch",
    "program": "${file}",
    "console": "externalTerminal"
},
Uncertain answered 10/10, 2018 at 10:37 Comment(0)
A
6

I had the same issue. Fixed it by using "integratedTerminal".

PS: My system is Windows 7.

{
    "name": "Debug",
    "type": "python",
    "request": "launch",
    "program": "${workspaceFolder}/main.Py",
    "console": "integratedTerminal"
}
Anthracoid answered 11/9, 2019 at 3:37 Comment(1)
Thanks! Python extension cannot restart configuration in the same terminal w/o this line since v2019.09: "Timeout waiting for debugger connection". I've had to close terminal window after every run. (Windows7)Stewart
C
5

Change your integrated terminal shell to cmd.exe. This will allow the default launch.json to debug with the Current File (Integrated Terminal) option.

This change has fixed other bugs in my Visual Studio Code + Python integration, such as the double call to Run Python File in Terminal that was frequently required. It was a nice suggestion coming from an internal dialog in version 1.28.2.

Carliecarlile answered 22/10, 2018 at 16:27 Comment(0)
R
5

I tried all the solutions that have been mentioned here. Nothing worked. Figured out the default timeout in debugpy that VSCode uses is 15 seconds. So if your app doesn't launch within 15 seconds, then VSCode throws this exception.

Solution that works: Create a new environment variable in your user account (not in launch.json) DEBUGPY_PROCESS_SPAWN_TIMEOUT and set it to 90

On Windows:

  1. Search for "Edit environment variables for your account"
  2. Create a new environment variable DEBUGPY_PROCESS_SPAWN_TIMEOUT
  3. Set the value to 90
  4. Close and reopen VSCode
Reporter answered 18/1, 2023 at 4:8 Comment(3)
does not work for me.Elyot
Works for me, thanks! :) I set the value to 180, some sites suggest higher:export DEBUGPY_PROCESS_SPAWN_TIMEOUT=500. It's important to close and reopen VS Code (as you said) so that VS Code recognizes the environment variable change. "Git Bash" is slow to open on my Windows machine (even without VS Code); I also activate a Python virtualenv. I'm not sure why Git Bash is so slow; maybe my company's antivirus software? Not sure. But if it's slow in general, it will be slow in VS Code, hence increasing the timeout helps.Toolmaker
I had this issue with a VPN that gets really slow at times. For this you can just update the "env" section in a specific launch.json entry with "env": { "DEBUGPY_PROCESS_SPAWN_TIMEOUT": "90" } and this doesn't require reloading the window or restarting VSCode.Alcoholize
H
3

I had the same issue today. The reason was that the debug settings were changed to "Current File (Integrated Terminal). Switching back to "Debug Console" fixed the problem for me.

You can find the settings in the drop-down menu right next to the debug button

Hade answered 15/10, 2018 at 22:42 Comment(0)
S
2

As I see by others' answers, the problem itself may differ from case to case. In my case, I had the gdb package missing. After reinstalling it with sudo apt-get update; sudo apt-get install gdb, I was able to use the debugger.

But if it doesn't help you, here is a nice way to find a reason in your case.

  1. Update the launch.json file and add "logToFile": true flag.
  2. Try running in the debug mode
  3. After failing, look for the details logs by this path: /root/.vscode-server/extensions/ms-python.python-2022.8.0 (it may differ based on your version of the Python VS code extension). The files you're looking for has the .log extension obviously
Szabo answered 19/6, 2022 at 10:20 Comment(0)
K
1

I got here using WSL.

I tried to restart a debug session and vs code just dropped back to the prompt. When I ran debug again it timed out as per the OP's error.

Solution was to kill the previous debug session in WSL bash (or vs code bash for that matter), one liner:

sudo kill -9 `ps ax | grep python | grep 5678 | cut -d' ' -f1`

Debug should work again.

Kamal answered 19/9, 2019 at 4:50 Comment(0)
B
1

Add cmd to your environment variables

That helped me to solve the problem.

You need to add the following path to your system variables path.

%SystemRoot%\system32

Good luck, I hope it solved your problem.

Butyl answered 14/4, 2021 at 20:19 Comment(0)
W
1

Changing your "integratedTerminal" shell to cmd.exe will fix it, because it's using "PowerShell".

  1. Open a new terminal pane : Press Ctrl+` (or View > Terminal in menu)

  2. Open a "Command Prompt"
    Open a "Command Prompt"

  3. Switch "cmd" to default (DO NOT switch to PowerShell)
    Switch to default profile

Whangee answered 7/2, 2022 at 4:56 Comment(0)
U
0

Migrating OP's solution from a comment to an answer:

I should have updated this some time ago. I believe this was happening because I was on Conda 2x. I upgraded to Conda 3x and the debugger has worked since. – bearcat  May 17, 2020 at 23:17

Uppsala answered 23/9, 2018 at 3:3 Comment(0)
B
0

I think this is going to work fine, I tried it:

"configurations": [
    {
        "name": "Python: Debug Console",
        "type": "python",
        "request": "launch",
        "program": "${file}",
        "console": "integratedTerminal"
    }
]
Brynhild answered 16/5, 2020 at 17:20 Comment(2)
does not work for meElyot
How does this differ from the answer posted 6 months prior? #52463099Uppsala
T
0

The 2018 answer by Lucas Rath worked for me, but:

  • it only worked after I made sure my program could run in the first place (my program didn't run due to an uncaught exception, so I couldn't debug until I found & fixed that exception)
  • Lucas' answer is similar to the the advice here, which I think might be better solution if you prefer to see a terminal open...

That is, you can continue to use launch.json "console": "integratedTerminal", but change your default terminal profile to the Command Prompt:

a screenshot showing how to change default terminal to the command prompt, open the terminal tab choose the "down arrow" icon next to the terminal "+" (creation) icon, choose "Select Default Profile", and choose whichever profile you want from the resulting list

(My suggestion is better if you prefer to see Command Prompt output in the opened terminal. But my suggestion is worse if you don't care about Command Prompt output, and/or you don't want to change your default terminal for whatever reason)


More context

I deleted details (see history of my edits), but in case they help other people find this question & answer, note if you use "Git Bash" as your integrated terminal and you try to debug you may see this error in the terminal after the "Timed out" dialog appears:

More details:
  File "<frozen runpy>", line 198, in _run_module_as_main
  File "<frozen runpy>", line 88, in _run_code
  File "c:\Users\username\.vscode\extensions\ms-python.python-2023.8.0\pythonFiles\lib\python\debugpy\adapter/../..\debugpy\launcher\__main__.py", line 91, in <module>
    main()
  File "c:\Users\username\.vscode\extensions\ms-python.python-2023.8.0\pythonFiles\lib\python\debugpy\adapter/../..\debugpy\launcher\__main__.py", line 47, in main
    launcher.connect(host, port)
  File "c:\Users\username\.vscode\extensions\ms-python.python-2023.8.0\pythonFiles\lib\python\debugpy\adapter/../..\debugpy\launcher/../..\debugpy\launcher\__init__.py", line 34, in connect
    raise e
  File "c:\Users\username\.vscode\extensions\ms-python.python-2023.8.0\pythonFiles\lib\python\debugpy\adapter/../..\debugpy\launcher/../..\debugpy\launcher\__init__.py", line 30, in connect
    sock.connect((host, port))
ConnectionRefusedError: [WinError 10061] No connection could be made because the target machine actively refused it

Another answer works

This other answer also works for me, without changing my terminal (i.e. still using Git Bash as my default terminal and using "console": "integratedTerminal" in my launch.json

I used a higher value (180) for the DEBUGPY_PROCESS_SPAWN_TIMEOUT environment variable, and I checked echo $DEBUGPY_PROCESS_SPAWN_TIMEOUT actually printed the value.

My "Git Bash" is slow to open in general (even without VS Code). Try opening your Git Bash after a fresh restart of your windows machine; if it takes longer than 15 seconds (default value for DEBUGPY_PROCESS_SPAWN_TIMEOUT), that explains the timeout! (Whereas opening my Command Prompt goes very quickly, which explains why using Command Prompt instead can work!)

Toolmaker answered 28/6, 2023 at 22:7 Comment(0)
G
0

have you ever changed the default terminal shell of vs code? I ran into the same question after changed the shell of vs code from "cmd" to "msys2". and configure below worked, though I dont know why. "python.terminal.activateEnvironment": false

Gaige answered 30/6, 2023 at 8:27 Comment(0)
G
0

As of 2024, add the following settings:

"terminal.integrated.automationProfile.windows": {
    "path": "${env:windir}\\Sysnative\\cmd.exe",
}

It will open the debugger in cmd, but usual "run" or "new terminal" in bash.

Gonium answered 31/5 at 19:20 Comment(1)
Rather than mentioning the year, it's better to mention instead the VS Code version, for example "As of VS Code 1.89, you can do this...". Because your solution could still be valid in 2025, as long as it's the correct version.Judie
S
-1

Personnaly I had the issue when having my working directory in a remote location (local network on a NAS). Copying the directory in my machine and working from there solves the issue.

Stipe answered 22/3, 2022 at 10:29 Comment(0)

© 2022 - 2024 — McMap. All rights reserved.