Adding table within the plotting region of a ggplot in r
Asked Answered
U

4

62

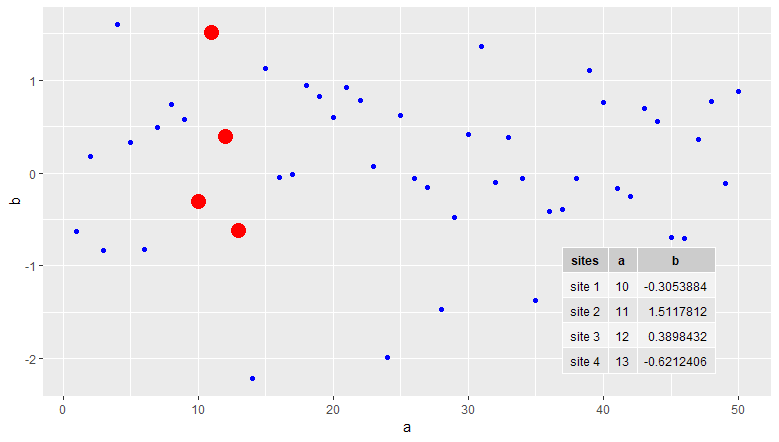
I would like to add a table of the coordinates of highlighted site in a ggplot.

Using a previous question as example data:

set.seed(1)
mydata <- data.frame(a=1:50, b=rnorm(50))
ggplot(mydata,aes(x=a,y=b)) + 
    geom_point(colour="blue") + 
    geom_point(data=mydata[10:13, ], aes(x=a, y=b), colour="red", size=5)

enter image description here

I would like to add the following table to the lower right-hand corner of the plot within the plotting region. Any advice?

table<-cbind(sites=c("site 1","site 2","site 3","site 4"),mydata[10:13,])
table

    sites  a          b
    site 1 10 -0.3053884
    site 2 11  1.5117812
    site 3 12  0.3898432
    site 4 13 -0.6212406
Uturn answered 7/9, 2012 at 12:28 Comment(0)
V
99

You can use ggplot2's annotation_custom with a tableGrob from the gridExtra package.

library(ggplot2)
library(gridExtra)
set.seed(1)
mydata <- data.frame(a=1:50, b=rnorm(50))
mytable <- cbind(sites=c("site 1","site 2","site 3","site 4"),mydata[10:13,])
k <- ggplot(mydata,aes(x=a,y=b)) + 
  geom_point(colour="blue") + 
  geom_point(data=mydata[10:13, ], aes(x=a, y=b), colour="red", size=5) + 
  annotation_custom(tableGrob(mytable), xmin=35, xmax=50, ymin=-2.5, ymax=-1)

enter image description here

Vitrics answered 7/9, 2012 at 12:57 Comment(7)
Nice. I'd chop at least four of the decimals from b though, unless you really care about 1 part in 10,000 precision (hint: you don't unless flying to Mars).Counterinsurgency
@mplourde Thank you! This is a very nice and straight forward solution. To make the table stand out better is it possible to put a frame around it?Uturn
take a look at ?tableGrob to see the aesthetics you can control. Using show.box=TRUE will frame the cells.Vitrics
control over aesthetics has changed in the last release, see the vignette for the various new options.Transgression
is it possible to remove the row numbers while displaying it ?Ruffin
is it possible to specify relative positioning , rather than absolute ?Ruffin
@Ruffin I don't believe so. You can use Inf and -Inf to push it to the extremities or the center, but it will fall outside of the plot region.Vitrics
L
27

With the release of 'ggplot2' 3.0.0 and 'ggpmisc' 0.3.0 a new simpler answer is possible:

library(ggplot2)
library(ggpmisc)

set.seed(1)
mydata <- data.frame(a = 1:50, b = rnorm(50))
table <- cbind(sites=c("site 1", "site 2", "site 3", "site 4"), mydata[10:13, ])

ggplot(mydata, aes(x = a, y = b)) + 
  geom_point(colour = "blue") + 
  geom_point(data = mydata[10:13, ], aes(x = a, y = b), colour = "red", size = 5) +
  annotate(geom = "table", x = 37, y = -0.8, label = list(table), 
           vjust = 1, hjust = 0)

'ggplot2' 3.0.0 fully supports tibbles (see release announcement) making it possible to map a list of data frames to the label aesthetic. The new geom_table() in package 'ggpmisc 0.3.0' takes advantage of this, making the addition of tables with a syntax similar to that of geom_label() possible (see documentation). Here seemed most appropriate to add the table as an annotation, but of course geom_table() can also be used directly, as other ggplot geometries.

enter image description here

Lounging answered 24/7, 2018 at 15:36 Comment(0)
L
14

@user3206440, @Punintended An easy way of removing row numbers exists: add rows = NULL to the call to tableGrob.

library(ggplot2)
library(gridExtra)
set.seed(1)
mydata <- data.frame(a=1:50, b=rnorm(50))
mytable <- 
   cbind(sites=c("site 1","site 2","site 3","site 4"), mydata[10:13,])
k <- ggplot(mydata,aes(x=a,y=b)) + 
  geom_point(colour="blue") + 
  geom_point(data=mydata[10:13, ], aes(x=a, y=b), colour="red", size=5) + 
  annotation_custom(tableGrob(mytable, rows=NULL), 
                    xmin=35, xmax=50, ymin=-2.5, ymax=-1)

Plot image

Please see the gridExtra Wiki.

Lounging answered 22/5, 2017 at 20:21 Comment(0)
S
1

@user3206440: I found a work-around that removes row numbers. I formatted my data as a matrix, assigned column names, then had tableGrob call that directly. Whenever I had tableGrob call it as a data frame, the row name persisted.

Below is an example. I'm sure there's an easier way to deal with the chisq.test output

chivalues <- chisq.test(chitable)
chidf <- matrix(c(unlist(c(round(as.numeric(chivalues[1]), 2),
                    chivalues[2], round(as.numeric(chivalues[3]), 5), numcells))),
                   nrow = 1, ncol = 4, byrow = FALSE)
colnames(chidf) <- c("Chi-Squared", "DF", "P Value", "Total Cells")

And then later...

annotation_custom(tableGrob(chidf), xmin=2, xmax=6, ymin=700, ymax=800)
Sybaris answered 6/3, 2017 at 19:48 Comment(0)

© 2022 - 2024 — McMap. All rights reserved.