customize ggplot2 axis labels with different colors
Asked Answered
A

4

67

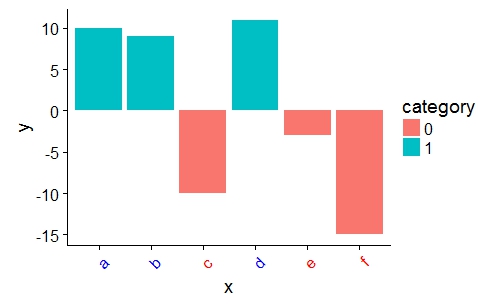
I have a basic bar graph I've created from ggplot2. The y variable contains both positive and negative values and about half the vector of values are negative. I would like to customize the axis labels such that when the y value of that corresponding x factor is a negative, its label is red. Here's a reproducible example:

#Create data
x <- c("a","b","c","d","e","f")
y <- c("10", "9","-10","11","-3","-15")
data <- data.frame(x, y)
data$y <- as.numeric(as.character(data$y))

data$category <- ifelse(as.numeric(data$y)<0, 0, 1)
data$category <- as.factor(data$category)

#Graph
library(cowplot) #theme
library(ggplot2)

ggplot(data, aes(x=x, y=y)) + 
  geom_bar(stat = "identity", aes(fill=category)) +
  theme(axis.text.x = element_text(angle = 45, hjust = 1)) +
  theme(axis.text.x = element_text(colour = "black"))

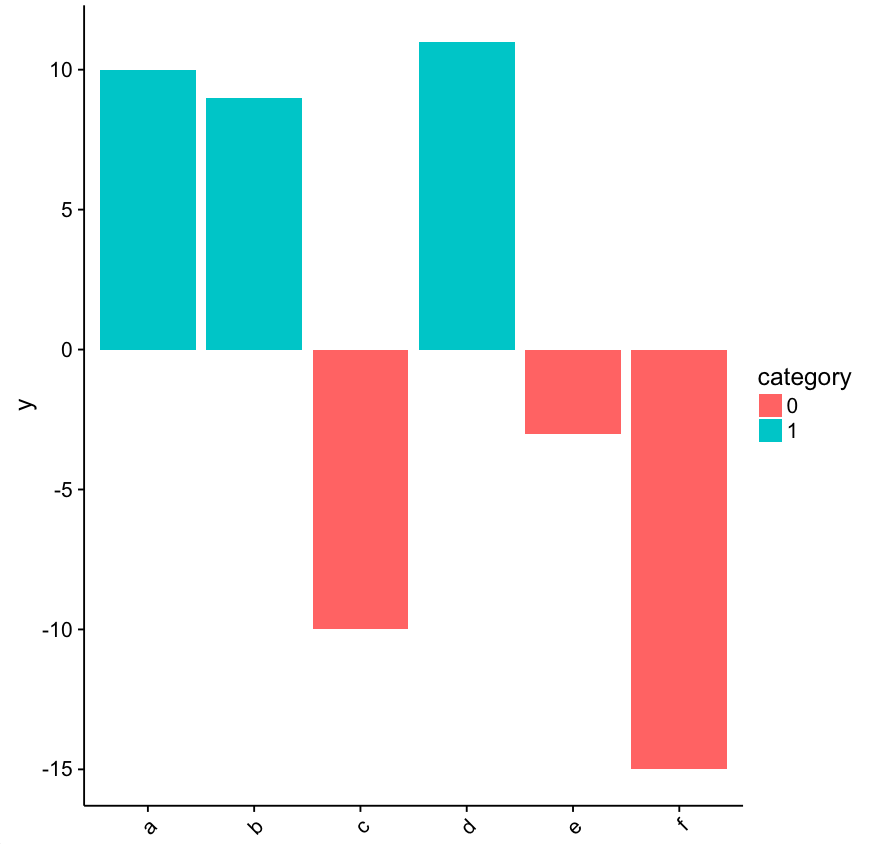
enter image description here

What I need is a way to change the label colors of "c", "e", and "f" to the color of my choosing. I tried toggling theme(aes(axis.text.x=element_text(colour=Air_pricier))) but that produced an error.

Astigmatic answered 10/8, 2016 at 0:7 Comment(0)
D
117

You can provide a vector of colors to the axis.text.x option of theme():

a <- ifelse(data$category == 0, "red", "blue")

ggplot(data, aes(x = x, y = y)) + 
    geom_bar(stat = "identity", aes(fill = category)) +
    theme(axis.text.x = element_text(angle = 45, hjust = 1, colour = a))

enter image description here

Distiller answered 10/8, 2016 at 0:29 Comment(6)
Is there a more automatic manner to set the axis label color to match the legend colors? This is especially needed when there are more than 2 categories that are not easily defined from each other except by name.Hosiery
@Hosiery use mystrings <- c("vector","of","categories") then a <- ifelse(data$category %in% mystrings, "red", "blue")Tupungato
'@Sumedh' what if I want ONLY the label to be set in different color?Burnside
This is nice, though generates a warning message for me Warning message: Vectorized input to "element_text()" is not officially supported. Results may be unexpected or may change in future versions of ggplot2. Tubulate
I also tried this in combination with facet_wrap, and it looks like it has to be the same colour scheme across all facets; i.e. you can't have different colour sets on different facets.Vane
The warning message Warning message: Vectorized input to "element_text()" is not officially supported. Results may be unexpected or may change in future versions of ggplot2. can be avoided by using ggtext::element_markdown instead of element_text which officially supports vectorized input.Purveyor
I
27

I, too, get the warning message mentioned in @Mark Neal's comment; it makes me nervous. Here's an alternative approach with the ggtext package. You can wrap the categories for the x-axis in <span>s and specify the color you want, and then use element_markdown in the theme:

library(ggtext)
library(tidyverse)

data %>%
  mutate(x.label = paste("<span style = 'color: ",
                         ifelse(y > 0, "black", "red"),
                         ";'>",
                         x,
                         "</span>", sep = ""),
         x.label = fct_reorder(x.label, as.character(x))) %>%
  ggplot(aes(x=x.label, y=y)) + 
  geom_bar(stat = "identity", aes(fill=category)) +
  theme(axis.text.x = element_markdown(angle = 45, hjust = 1))

enter image description here

Issue answered 11/11, 2020 at 23:1 Comment(4)
Is there any other alternative using the ggplot2 standard verbs (without using an extension such as ggtext)?Dygert
Not that I've been able to find. But if there's a standard ggplot2 solution, I would love to use that instead!Issue
This works nicely. you can also define this in the labels of scale_x_discrete so you don't have to change the x-values in your data. You can also create the labels in the discrete scale with glue templates for maximum flexibility and convenience.Secund
I added an answer that creates two plots (one with the graph and one with the labels) and combines them. This way the labels can be created using the "grammar of graphics" that ggplot2 provides.Celtic
S
7

Building on a-s-k's answer I put this in a more flexible form using glue templates and a discrete scale. With this option you don't have to change your data but just define a labeler in the scale that does everything for you, this is handy if you want to color the x-axis in many similar plots with different data.

(In the case of the original question the color depends on more of the data, than just the x-values, but I guess this could still be handy for some users.)

library(ggtext)
library(tidyverse)
library(glue)

#Create data
x <- c("a","b","c","d","e","f")
y <- c("10", "9","-10","11","-3","-15")
data <- data.frame(x, y)
data$y <- as.numeric(as.character(data$y))

data$category <- ifelse(as.numeric(data$y)<0, 0, 1)
data$category <- as.factor(data$category)

# create the labels 
my_labels <- glue_data(
  data, 
  "<span style='color: {if_else(category==0, 'red', 'blue')}'>{x}</span>"
  )
names(my_labels) <- data$x

# plot as you normally would
# use element_markdown as axis.text.x
# and the labels defined before as labels in a discrete scale
ggplot(data, aes(x=x, y=y)) + 
  geom_bar(stat = "identity", aes(fill=category)) +
  theme(
    axis.text.x = element_markdown(angle = 45, hjust = 1)
  ) + 
  scale_x_discrete(labels=my_labels)
Secund answered 3/11, 2021 at 15:48 Comment(0)
C
2

An alternative is to create the labels as a separate plot object and use a package such as cowplot or patchwork to combine them.

#Create data
x <- c("a","b","c","d","e","f")
y <- c("10", "9","-10","11","-3","-15")
data <- data.frame(x, y)
data$y <- as.numeric(as.character(data$y))

data$category <- ifelse(as.numeric(data$y)<0, 0, 1)
data$category <- as.factor(data$category)

# Base plot
library(ggplot2)

pl_base <-
  data |>
  ggplot(aes(x = x))

# Graph
pl_points <-
  pl_base +
  geom_bar(stat = "identity", aes(y = y, fill = category)) +
  theme(plot.margin = unit(c(0,0,0,0), "lines"),
        axis.title.x = element_blank(),
        axis.text.x = element_blank())

# x axis labels
pl_xlab <- pl_base +
  geom_text(aes(label = x, color = category), y = 0, size = 3) +
  scale_y_continuous(expand = c(0, 0), limits = c(0, 0)) +
  #guides(color = "none") + # uncomment to remove the extra legend
  theme_void()

# Combine with patchwork
library(patchwork)
pl_final <-
  pl_points +
  pl_xlab +
  plot_layout(ncol = 1,
              heights = c(NA, 0.07),
              guides = "collect")

# Combine with cowplot
library(cowplot)
pl_final <-
  plot_grid(pl_points,
            pl_xlab,
            ncol = 1,
            align = "hv",
            axis = "b",
            rel_heights = c(1, 0.07))

pl_final

ggplot2 with patchwork output

This is very flexible but it can be difficult to position the labels correctly when changing the width/height of the final plot output.

Celtic answered 20/9, 2023 at 8:44 Comment(0)

© 2022 - 2024 — McMap. All rights reserved.