How do I see the raw HTTP request that the HttpWebRequest class sends?
Asked Answered
B

9

88

I know you are all going to answer "use a debugging proxy server like Fiddler" but it's not that simple.

Here's my situation: I have some code that runs on a server, in an ASP.NET page code-behind (aspx.cs), which (among other things) establishes a connection to another server, grabs some stuff, and then formats it and returns it to the browser.

The problem is that the other server is doing the wrong thing, and so I want to be able to pass a debugging flag into the page (via the query string, e.g. ?debug=true) so that it will print out the completely raw HTTP request that it is sending to the other server so I can see what the heck is wrong. This code is running in several places so I want to be able to just pass in this flag on dev, staging, or production and just see the request, without having to figure out whether the production servers can talk to some proxy server that exists somewhere, etc.

You would think that it would be easy to do this, right? So I feel like I'm crazy or something but I looked at the reference for HttpWebRequest and its parent class WebRequest and -- nothing. No can do. You would think Microsoft would have thought of this. The closest thing is that you can access the "Headers" collection but when I tried it, it omitted some really important headers like "content length" -- so it must be "lying" to me (I know it's lying, because I know for a fact that the remote server is returning a 200 status -- the request is successful, it's just returning bad/different/wrong data)

Here is the asked-for code example:

HttpWebRequest req = (HttpWebRequest)WebRequest.Create("http://www.whatever.com");
req.Method = ... whatever ...;
... other setup for the request ...
/* At this point we are about to send the request.
   What does the raw HTTP request look like? */
HttpWebResponse resp = (HttpWebResponse)req.GetResponse();
Baleful answered 27/9, 2010 at 21:25 Comment(6)
Is it possible for you to replace HttpWebRequest with some other component? If yes, you can take some third-party HTTP component that lets you capture whatever is sent (or the headers) to do the job.Machmeter
Have you tried Firebug for firefox? It's pretty powerful, I don't know how it compares to Fiddler but maybe it has what you need?Shizukoshizuoka
Firebug won't help, since the interesting part happens between two servers - Firebug sits inside Firefox, and it can only inspect what happens between one server and the client.Rollicking
Eugene, do you know of any components? I thought about implementing my own version of HttpWebRequest but that is a hell of a lot of work. I do not know if it's possible to subclass HttpWebRequest and access any useful properties that way.Baleful
A simple code example exhibiting the problem would be helpful. Are you calling GetRequestStream so that you can send POST data, or is this a simple GET request?Theologue
Jim, I added a code example. In my case, it is a POST and I am calling GetRequestStream, but I'd like to be able to do this for any type of request, GET or POST. Note that GetRequestStream gives me only the content/body, not the headers, and in fact it will throw an exception if you try calling GetRequestStream for a GET request.Baleful
A
14

You can use System.Net tracing mechanism to see the raw HTTP requests sent on the wire. You can also add your own tracelistener to the process.

Amorette answered 28/9, 2010 at 3:28 Comment(5)
I haven't tried that, this looks like a good option. Thanks!Baleful
didn't work for me for some reason, though this seems like the best answer anyway (I won't take away the checkmark). See my post here: #3823441Baleful
Hmm.. This has always worked for me, of course - I always do console apps. DId you make sure that you gave the ASP.NET identity (account) write access to the file/directory where you want the trace output to be written?Amorette
Worked well for me - using a Console App. Was a spelling mistake that was causing it to fail. Thanks!Metrology
This kind of answer should include instructions.Donor
W
181

I realise that this is an old question. @feroze's answer says what to do, but does not go into any detail on how to set up System.Net tracing to achieve it.

As this question was the first Google result for my query into the subject, and as we are all busy people, I thought I would save you all from having to hunt down this information.

System.Web is very powerful for debugging HttpWebRequests and can be easily set up using the web.config:

<configuration>
    <system.diagnostics>

        <trace autoflush="true" /> 

        <sources>
            <source name="System.Net" maxdatasize="1024">
                <listeners>
                    <add name="MyTraceFile"/>
                    <add name="MyConsole"/>
                </listeners>
            </source>
        </sources>

        <sharedListeners>
            <add
              name="MyTraceFile"
              type="System.Diagnostics.TextWriterTraceListener"
              initializeData="System.Net.trace.log" />
                <add name="MyConsole" type="System.Diagnostics.ConsoleTraceListener" />
        </sharedListeners>

        <switches>
            <add name="System.Net" value="Verbose" />
        </switches>

    </system.diagnostics>
</configuration>

Adding a simple HttpWebRequest in your code, and running in debugging mode in Visual Studio, the following information will be displayed in the debug console:

System.Net Verbose: 0 : [6596] WebRequest::Create(https://example.com/service.asmx)
System.Net Verbose: 0 : [6596] HttpWebRequest#62063506::HttpWebRequest(https://example.com/service.asmx#11234)
System.Net Information: 0 : [6596] RAS supported: True
System.Net Verbose: 0 : [6596] Exiting HttpWebRequest#11234::HttpWebRequest() 
System.Net Verbose: 0 : [6596] Exiting WebRequest::Create()     -> HttpWebRequest#11234
System.Net Verbose: 0 : [6596] HttpWebRequest#11234 ::GetRequestStream()
System.Net Verbose: 0 : [6596] ServicePoint#11234 ::ServicePoint(example.com:443)
System.Net Information: 0 : [6596] Associating HttpWebRequest#11234with ServicePoint#11234
System.Net Information: 0 : [6596] Associating Connection#11234 with HttpWebRequest#11234 
System.Net Information: 0 : [6596] Connection#11234 - Created connection from x.x.x.x:xx to x.x.x.x:xx.
System.Net Information: 0 : [6596] TlsStream#11234 ::.ctor(host=example.com, #certs=0)
System.Net Information: 0 : [6596] Associating HttpWebRequest#11234 with ConnectStream#11234 
System.Net Verbose: 0 : [6596] Exiting HttpWebRequest#11234 ::GetRequestStream()    -> ConnectStream#11234 
System.Net Verbose: 0 : [6596] ConnectStream#7740977::Write()
System.Net Verbose: 0 : [6596] Data from ConnectStream#11234::Write
System.Net Verbose: 0 : [6596] 00000000 : 3C 73 6F 61 70 3A 45 6E-76 65 6C 6F 70 65 0D 0A : <soap:Envelope..
...etc

I found this especially useful when trying to find out the cause of a webservice client error. It turned out I was missing a header.

Warmongering answered 5/9, 2014 at 10:12 Comment(3)
Wow. This little utility was EXACTLY what I needed. I had a console program making post requests that was working perfectly but an ASP.NET WebForm application that was failing with the same requests. This utility showed me the difference in the raw POST request which is what I needed! Just by adding it to the web.config and app.config files as appropriate. Thanks kamui!Informality
So much more convenient than having to bother with setting up/using Fiddler or Wireshark.Pitchdark
Chances are if you want this it will be helpful to have some timestamps - see this answer and comments for details: https://mcmap.net/q/242892/-add-timestamp-to-trace-writeline The short version is you should add something like this to your config file: <add name="MyTraceFile" type="System.Diagnostics.TextWriterTraceListener" initializeData="System.Net.trace.log" traceOutputOptions="DateTime" />Fishback
A
14

You can use System.Net tracing mechanism to see the raw HTTP requests sent on the wire. You can also add your own tracelistener to the process.

Amorette answered 28/9, 2010 at 3:28 Comment(5)
I haven't tried that, this looks like a good option. Thanks!Baleful
didn't work for me for some reason, though this seems like the best answer anyway (I won't take away the checkmark). See my post here: #3823441Baleful
Hmm.. This has always worked for me, of course - I always do console apps. DId you make sure that you gave the ASP.NET identity (account) write access to the file/directory where you want the trace output to be written?Amorette
Worked well for me - using a Console App. Was a spelling mistake that was causing it to fail. Thanks!Metrology
This kind of answer should include instructions.Donor
E
5

You can use a network traffic sniffer like wireshark.

This is not a debugging proxy, but will sniff all traffic and let you see the raw requests/responses.

Esquiline answered 27/9, 2010 at 21:29 Comment(4)
If that is like typical packet sniffers I have installed at home in the past, that would most likely require a level of admin access that I do not have here at work. I wouldn't be able to use it here in the office because, to put it simply, I'd be able to read my bosses' emails. Ironically it might be easier to get admin access if I could remote desktop into the production servers, but the problem with that is that I don't have any access to them at all, not even to push files (another company does that).Baleful
I would just use the technique I have outlined above - install a Tracelistener in your appdomain using a web.config file, and have the tracelistener write the debug spew to the local disk, or into the webpate that is then rendered to the client.Amorette
I've found Fiddler (fiddler2.com) to be a very simply solution for this problem.Outdoors
Remember that Wireshark will not capture localhost traffic. Instead use a tool called RawCap to capture localhost traffic to a file and then analyse it with Wireshark.Varney
B
5

answering my own question here, because I thought of another way to do it. Basically the idea is -- you re-point the HttpWebRequest to a page that logs the incoming raw HTTP Request. In other words set up a custom HTTP handler as per this forum post:

http://forums.asp.net/t/353955.aspx

And then change just the URL in the HttpWebRequest to point to this new endpoint, but keep all other elements of the request the same. Write the result to a file or something and you're golden.

Baleful answered 6/10, 2010 at 15:5 Comment(0)
I
4

I know this is an old question, but I was in a tough spot where I didn't control the application config file, so I needed an easy way to enable the tracing via code and then easily access the raw request/response data in an event. So I put together this custom class, HttpRawTraceListener, which might be of use to others that are in my position:

https://github.com/jhilgeman/HttpRawTraceListener/blob/master/HttpRawTraceListener.cs

It was designed to be as simple as adding the file to your project, then calling:

System.Diagnostics.HttpRawTraceListener.Initialize();

...to start the trace. From there, requests/responses will be parsed out of the trace messages and then be made available via the System.Diagnostics.HttpRawTraceListener.FinishedCommunication event.

It's probably not 100% perfect for every scenario (e.g. it's not a proxy, so it won't capture web requests from a browser, for example), but it works pretty well for capturing HttpWebRequests requests/responses to web services, and it might be a good starting point if you need something like this.

Itacolumite answered 11/6, 2019 at 20:31 Comment(4)
This is exactly what I need, but I am not able to get it work. I have static main method in console application. I initialized() HttpRawTraceListener and also setup FinishedCommunication but when i execute HttpClient().PostAsync() nothing is catched :/ I am using .net framework 4.6.1Sesquiplane
Using HttpClient.PostAsync will result in a buffered read / lazy result on the response, which will not be part of the System.Net logging, so the end result is that the listener class won't be able to see the full response in order to finish the communication.Itacolumite
However, I could probably update the listener to just listen for that scenario and finish the communication anyway so you could see everything except the raw response body.Itacolumite
loved this idea and saw it mentioned in numerous places. however when i run this it throws null ref exceptions all through initialize method. on .net 4.5 framework, the internal system.net.logging type loads ok but it doesn't find any fields named: s_LoggingInitialized, s_LoggingEnabled, nor the property 'Web'.Aggressive
E
3

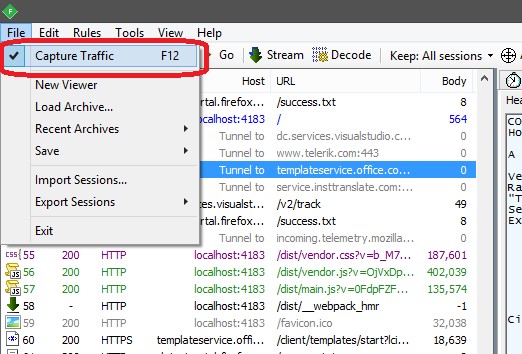
I suggest you to download Telerik Fiddler to capture incoming/outcoming traffic.

Over here is simple example how to do it by that tool:

  1. Be sure that the Capture Traffic is enabled: enter image description here
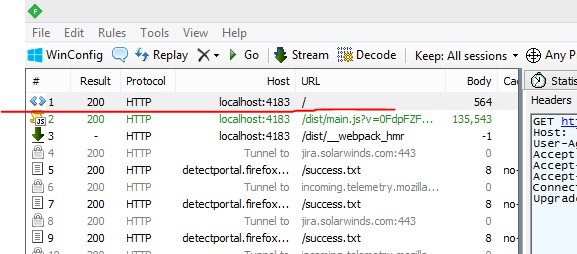
  2. Open browser and refresh the page, or just send request via HTTP client. enter image description here
  3. After that switch to the Fiddler, you should see your request: enter image description here
  4. At the top try to navigate “Raw” tab. enter image description here
  5. In the below window is your raw request enter image description here
Extramundane answered 13/3, 2018 at 14:39 Comment(2)
Is it possible to see HTTPS requests and decrypt them, if you have the key ?Sesquiplane
Could you check it: docs.telerik.com/fiddler/Configure-Fiddler/Tasks/DecryptHTTPS or try google: "telerik fiddler capture https traffic".Extramundane
C
1

Another suggestion. Implement your own web proxy, and set your request to use it with WebRequest.Proxy. Then you should be able to extract the traffic from the proxy instance.

Edit: update for links.

Connect answered 27/9, 2010 at 22:17 Comment(4)
Yeah I thought about doing that, it seems like maybe the only way. But it introduces a lot of complexity. Let's say I implement a web proxy that sits on the same server as the site. What does it do with the output? Log it to a file? Is there a way to connect to the proxy and see the log, given that I do not have access to the server? I think it would be hard or impossible to set this up on the production server because it would require opening up a new port to direct proxy traffic to, and that would not be allowed by admins.Baleful
Well, the proxy could refuse all requests that don't originate from the local machine. You don't need to open the port up to the outside world. You could do all of this or only the requests through the proxy only in a #IF DEBUG section. Have it log to the event log or to a file, and then have production send you the logs. That's about the best you can do, outside of asking them to run Fiddler on the production machine for you. Personally, I would push for this (them running Fiddler), honestly, if it means saving time and money instead of rolling your own in-process proxy logger, seriously.Connect
Also, can you just set up test server(s) that mimics your production environment using some VMs? Is the problem really only limited to this one machine?Connect
You would not believe the amount of bureaucracy involved in maintaining these servers... I think system.net tracing might be the best way to go about this.Baleful
S
0

You say that you think .NET is lying to you, and the specific example you give is that the header Content-Length is missing from the HTTP response.

But the header Content-Length is not required from an HTTP response. In fact, if the body of the response is in any dynamic, and if its length is not known in advance, then it is highly likely that the Content-Length header will be omitted!

Scissor answered 28/9, 2010 at 3:42 Comment(4)
I'm talking about requests, not responses. Here's the test I conducted: I ran the program, it made an http request and got a response. I then hand-crafted a request (in fiddler) based on the exact information that .NET told me it was sending (printing out HttpWebRequest.Headers, HttpWebRequest.Method, etc). Specifically, this request omitted Content-Length. But the server came back with an error stating that Content-Length was required (which makes sense, since it was a POST request). Therefore, I'm having trouble trusting what .NET reports.Baleful
p.s. also, the exact same .NET code reported a different set of headers when I ran it on two servers which had two different versions of .NET. Now maybe the two versions of .NET were actually producing different headers, IDK. But it makes me suspicious nonetheless and I'd like a raw dump.Baleful
w3.org/Protocols/rfc2616/rfc2616-sec4.html#sec4.4 - Content-Length must NOT be given in a number of circumstances, including when using chunked transfer encoding. Is the target server HTTP/1.1-aware?Scissor
Well the server was configured to return a 411 error when Content-Length was missing (tested this by hand-crafting a request in fiddler). So the point is, when I instantiate an HttpWebRequest and set it up, then print out the headers, it doesn't include Content-Length as a header. But if that were true, then it would be getting a 411 when I call GetResponse on httpWebRequest -- but that's not the error I'm getting. It's succeeding with a 200 and giving me bad data (a different problem). So therefore .NET is lying about the headers.Baleful
S
0

This answer does not include the request content. (But it still may help if you need to diagnose connection issues).

Trace logging of the System.Net code in .NET Core can be captured by making a class that inherits from System.Diagnostics.Tracing.EventListener

See https://github.com/dotnet/runtime/issues/64977 for details + original suggestion.

Example:

private class SystemNetEventListener : EventListener
{
  protected override void OnEventSourceCreated(EventSource eventSource)
  {
    // take anything from System.Net
    if (eventSource.Name?.StartsWith("Private.InternalDiagnostics.System.Net.") == true)
    {
      EnableEvents(eventSource, EventLevel.LogAlways);
    }
  }

  protected override void OnEventWritten(EventWrittenEventArgs eventData)
  {
    try
    {
      // produce a string that can be logged
      var sb = new StringBuilder().Append($"{eventData.TimeStamp:HH:mm:ss.fffffff}[{eventData.EventName}] ");
      for (int i = 0; i < eventData.Payload?.Count; i++)
      {
        if (i > 0)
          sb.Append(", ");
        sb.Append(eventData.PayloadNames?[i]).Append(": ").Append(eventData.Payload[i]);
      }

      Console.WriteLine(sb.ToString().Trim());
    }
    catch
    {
      // on failure... well... we are the logger, so there's nobody to tell we failed
    }
  }
}

Usage:

var listener = new SystemNetEventListener(); // start logging
... // do HTTP/Websocket stuff
listener.Dispose(); // stop logging
Scyphozoan answered 19/10, 2023 at 22:31 Comment(0)

© 2022 - 2024 — McMap. All rights reserved.